Visualizing Customer Segmentation with Semi-Circular Diagram
RM0400008_11
- Last Update 02/16/2025
- Slide Ratio 16:9
- Color
Keywords
- #Content-Based Slides
- #Design-Based Slides
- #Company Introduction
- #Market and Competitor Analysis
- #Diagram
- #Business Areas
- #Customer Analysis
- #Spread
- #Radial Diagram
- #16:9
- #semi-circular diagram PowerPoint
- #customer segmentation slide
- #semi-circle chart template
- #customer segment analysis PPT
- #how to create segmentation diagram in PowerPoint
About the Product
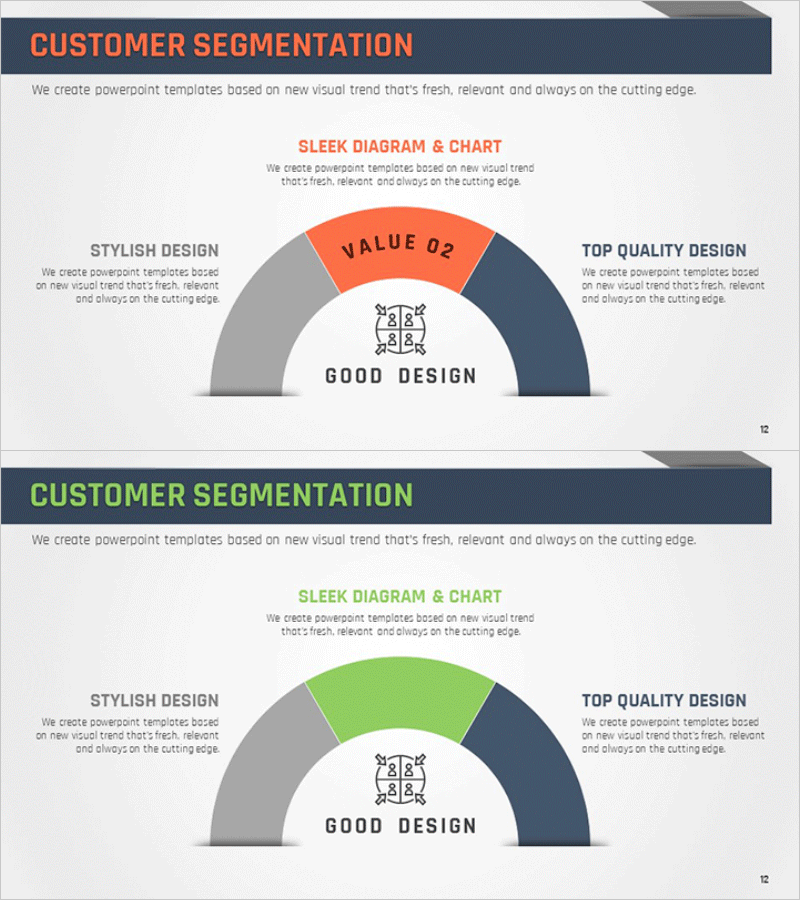
A semi-circular diagram PowerPoint slide designed to visualize customer segmentation strategy. The layout features three distinct sections: gray on the left, orange in the center, and navy blue on the right, clearly representing different customer groups. A central icon and text area emphasize key messaging, while the symmetrical left-right layout ensures balanced information delivery. The 2-slide set includes color variations (orange and green versions) for flexible presentation contexts. Fully editable in PowerPoint format, this slide is ideal for customer analysis, marketing strategy presentations, and business proposals.
Usage Points
-
Main Usage
Visually classify customer groups and clearly communicate the characteristics of each segment. This diagram is essential for marketing strategy, business analysis, and customer insight presentations where complex segmentation data needs intuitive visual representation.
-
How to Use
Enter customer segment names (e.g., price-sensitive, quality-focused, premium) in each semi-circular section. Add key messages or statistics in the central icon area, and describe each segment's characteristics in the left and right text boxes. Select the color variation that matches your presentation theme.
-
Recommended For
Marketing professionals, business analysts, sales strategy teams, and executives preparing customer analysis reports. Ideal for market research presentations, customer satisfaction analysis, and target marketing strategy discussions.
-
Slide Structure
Three-segment semi-circular layout with gray (left), orange/green (center), and navy blue (right) sections. Central area contains icon and 'GOOD DESIGN' text field. Top left and right include 'STYLISH DESIGN' and 'TOP QUALITY DESIGN' labels with descriptive text boxes. Two-slide set with color variations (orange version and green version).
Related Products
-

Core Competency Diagram That Drives Growth
#Company Introduction #Business Vision and Strategy #Diagram
-

Stylish Learning Icons and Content Description Slide
#Market and Competitor Analysis #Marketing Plan and Strategy #Diagram
-

Pie Slice Circle Diagram - A Quick Look at Customer Segmentation
#Company Introduction #Market and Competitor Analysis #Diagram
-

Diagram of Chemical Experiments by Year – Cluster Visualization
#Company Introduction #Diagram #History
