Sleep Effect Diagram – Centralized Data Visualization
RJ0800001_26
- Last Update 07/31/2025
- File Size 0.5MB
- # of Slides 2
- File Format PPTX
- Slide Ratio 16:9
- Color
Keywords
- #Content-Based Slides
- #Design-Based Slides
- #Company Introduction
- #Market and Competitor Analysis
- #Diagram
- #Other
- #Business Areas
- #Customer Analysis
- #Spread
- #Centralized Diagram
- #16:9
- #radial diagram PowerPoint
- #central concept expansion slide
- #6-node diagram template
- #data visualization PowerPoint
- #business analysis diagram
About the Product
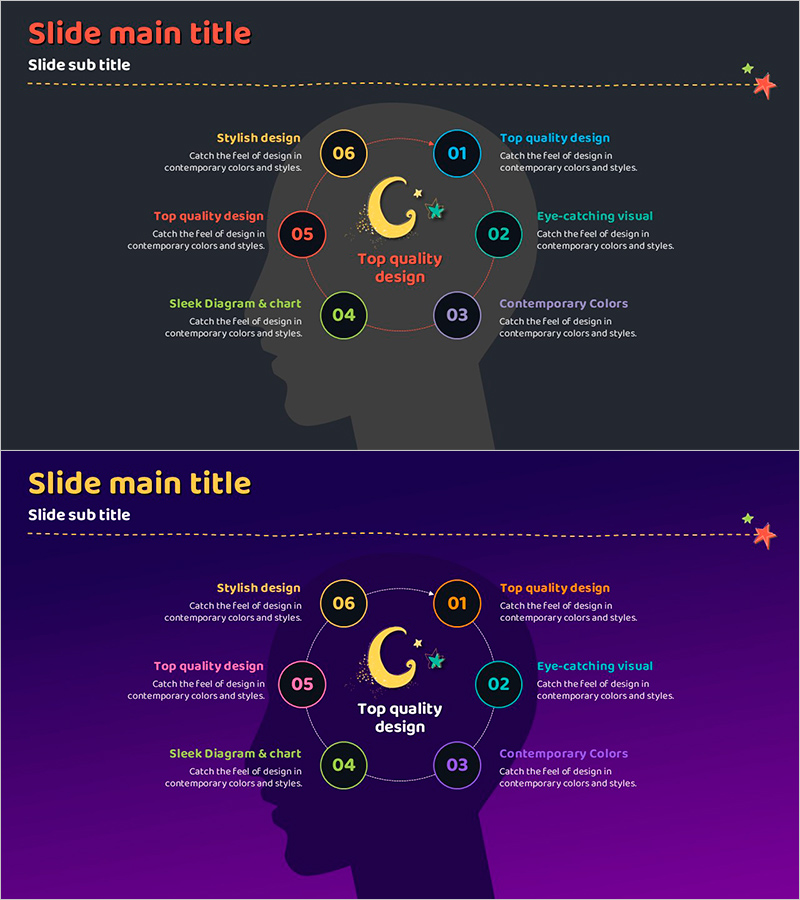
A radial diagram PowerPoint slide with a central concept and six nodes expanding outward in a circular pattern. The dark gray background features numbered circular nodes in gold, cyan, lime, orange, and pink, connected to the center by lines. Each node includes space for a title and descriptive text. The 2-slide set includes both dark and purple theme versions, allowing you to match your presentation's tone. This diagram is ideal for visualizing information structures where multiple elements, strategies, or categories branch out from a central concept, making it perfect for market analysis, customer segmentation, and strategic planning presentations.
Usage Points
-
Main Usage
Visualizes information structures where a central concept branches into multiple related elements, strategies, or categories. Emphasizes the importance of the core concept while clearly showing relationships between surrounding elements.
-
How to Use
Enter your main topic in the central moon-shaped icon area, then fill in the six circular nodes with specific items, strategies, or analysis results. The pre-assigned colors help distinguish categories, and presenting from center outward enhances audience comprehension.
-
Recommended For
Marketing strategy development, customer segmentation analysis, organizational structure explanation, product feature overview, business model analysis, and competitive comparison. Ideal for executive presentations, marketing team reports, and strategic planning proposals.
-
Slide Structure
Central area with moon icon and text input field, surrounded by six numbered circular nodes (01-06) positioned in cardinal and diagonal directions. Each node contains a title area and descriptive text space, connected to the center by lines. Both slides maintain identical structure with different background colors.
Related Products
-

Business Area PC Mockup Diagram – Optimized for Market Analysis
#Company Introduction #Market and Competitor Analysis #Diagram
-

Silhouette Diffusion 3D Diagram – Dynamic Business Structure Representation
#Company Introduction #Business Introduction #Diagram
-

Customer Feedback Breakdown by Gender – Insightful Data Visualization
#Market and Competitor Analysis #Customer Success Stories #Diagram
-

Human Head Structure Diagram – Simple and Intuitive Visualization
#Company Introduction #Business Introduction #Diagram
