Competitor Growth Comparison Table – Effective Analysis Tool
RM0400009_10
- Last Update 02/17/2025
- File Size 1.5MB
- # of Slides 2
- File Format PPTX
- Slide Ratio 16:9
- Color
Keywords
- #Content-Based Slides
- #Design-Based Slides
- #Market and Competitor Analysis
- #Diagram
- #Competitor Analysis
- #Table
- #16:9
- #competitor analysis table PPT
- #competitor comparison PowerPoint slide
- #market analysis table design
- #competitive landscape comparison slide
- #how to create competitor comparison in PowerPoint
About the Product
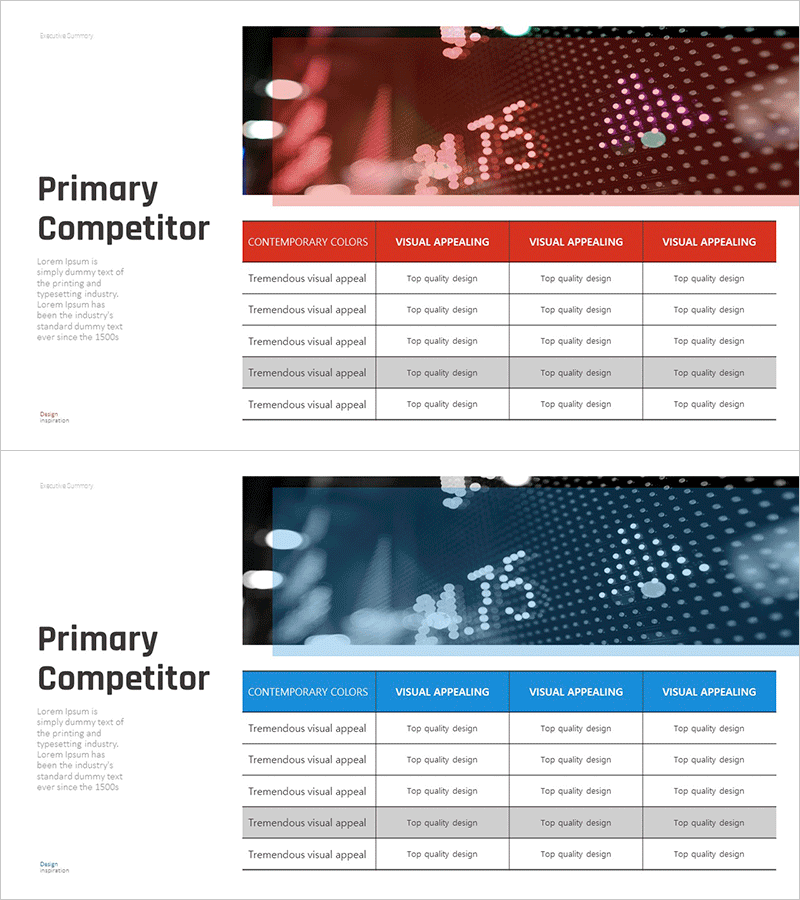
A PowerPoint slide designed to compare competitor growth metrics at a glance. The red and blue dual-tone header strengthens visual differentiation, while the clear 5-row by 4-column table structure displays key indicators across multiple competitors simultaneously. Each cell provides ample text input space for market analysis, growth rates, quality assessments, and other competitive data. The 2-slide set includes both red and blue versions, allowing you to match your presentation style and brand colors. Optimized for investor presentations, executive briefings, and strategic planning meetings where competitive positioning must be communicated clearly.
Usage Points
-
Main Usage
Compare key competitor metrics—growth rates, market share, quality ratings, pricing competitiveness—simultaneously to clarify your company's market positioning. Deliver data-driven competitive analysis in investor relations, executive strategy meetings, and marketing planning presentations with visual impact.
-
How to Use
Enter competitor names in the first column and comparison criteria (growth rate, market share, customer satisfaction, technology strength) in the remaining four columns. Adjust text size and cell colors to highlight critical data points. The red version conveys aggressive positioning; the blue version projects trust and stability.
-
Recommended For
Executives, marketing managers, strategy planners, investor relations professionals, business development managers. Use in competitive analysis reports, business plans, investor pitch decks, quarterly business reviews, and market entry strategy presentations.
-
Slide Structure
2-slide set. Each slide features a 5-row by 4-column table with a red (or blue) header row identifying comparison categories. The remaining 4 rows serve as data entry areas for each competitor, with clear text-based information hierarchy optimized for horizontal comparison and quick data scanning.
Related Products
-

Visualizing Competitive Analysis with Table and 3 Donut Graphs
#Market and Competitor Analysis #Diagram #Graph
-

Competitor Comparison Graph & Table - Essential Tool for Market Analysis
#Market and Competitor Analysis #Diagram #Competitor Analysis
-

Dawn City Theme Competitor Analysis Graph – Understanding Market Trends
#Market and Competitor Analysis #Diagram #Graph
-

Line Chart & Table – Market and Competitor Analysis
#Market and Competitor Analysis #Diagram #Graph
