Ringer Shape Subdivided Column Graph – Marketing Effect Analysis Report
RM0400008_31
- Last Update 02/17/2025
- File Size 7.2MB
- # of Slides 2
- File Format PPTX
- Slide Ratio 16:9
- Color
Keywords
- #Content-Based Slides
- #Design-Based Slides
- #Product/Service Introduction
- #Operational Plan
- #Diagram
- #Program Introduction
- #Post-Implementation Management & Maintenance
- #Cluster
- #Closed Cluster Diagram
- #16:9
- #4-series vertical bar chart PowerPoint
- #subdivided column graph slide
- #marketing performance analysis PPT
- #data comparison chart template
- #sales report presentation slide
About the Product
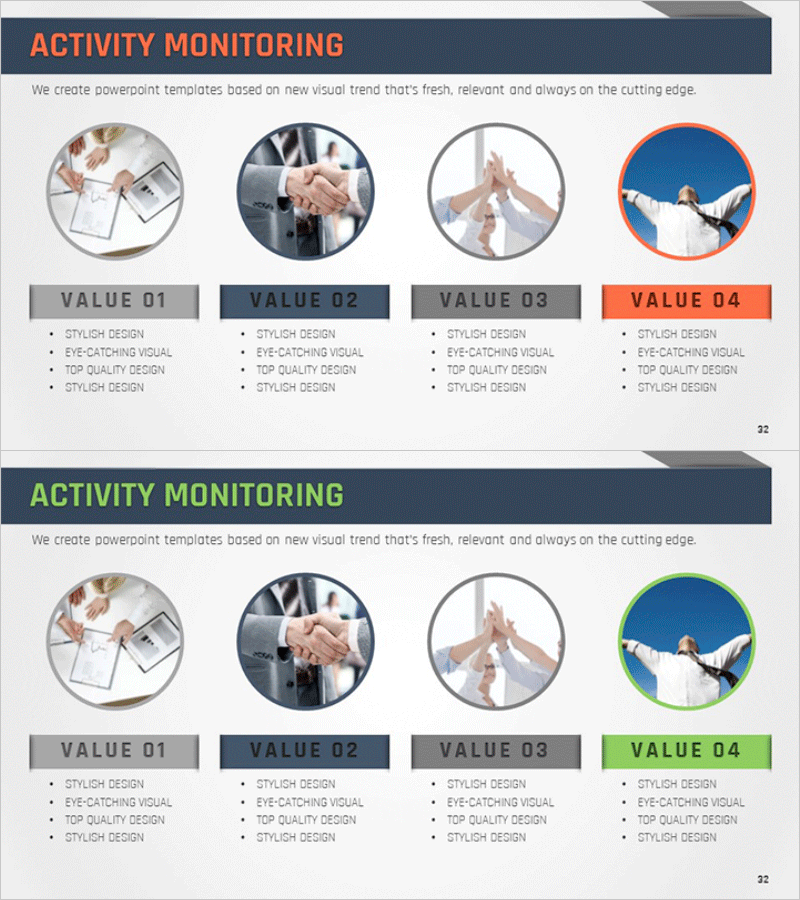
A vertical bar chart PowerPoint slide designed for marketing effectiveness analysis and performance reporting. The 4-series subdivided column graph features a distinctive circular border design with orange, navy blue, and gray accent colors that enhance data visualization. Delivered as a 2-slide 16:9 PPTX template ready for immediate editing. Perfect for marketing performance reports, operational planning presentations, and program introductions where multi-category data comparison is essential.
Usage Points
-
Main Usage
Visualize marketing campaign performance, channel effectiveness, and period-over-period metrics across four data series simultaneously. The circular border design emphasizes each category while the vertical bar structure enables intuitive comparison of numerical differences.
-
How to Use
Apply this slide in marketing reports, performance review presentations, and operational planning sessions. Edit bar heights to reflect actual performance data, add legend labels and value annotations to enhance audience comprehension. Use the orange accent bar to highlight key performance indicators.
-
Recommended For
Marketing managers, planning teams, and executives presenting campaign ROI, channel performance, quarterly trends, and budget allocation reviews. Ideal for situations requiring comparison of four or more data categories in strategic planning meetings.
-
Slide Structure
2-slide deck. Slide 1: Title area with 4-series vertical bar chart featuring circular border design and value labels. Slide 2: Identical graph layout for flexible data set application. 16:9 aspect ratio PPTX format.
Related Products
-

Introducing the Fintech Program – Innovative Financial Management
#Product/Service Introduction #Business Management #Diagram
-

Online Shopping Mall Service Program Slide – Customer-Centric Innovation
#Company Introduction #Product/Service Introduction #Diagram
-

Diagram Slide Visualizing Characteristics of the Fintech System
#Product/Service Introduction #Diagram #Features
-

Slides Visualizing Business Goals with Pentagon Diagram
#Product/Service Introduction #Business Vision and Strategy #Diagram
