Diagram Slide Visualizing Characteristics of the Fintech System
RJ0400058_26
- Last Update 06/02/2025
- File Size 0.2MB
- # of Slides 2
- File Format PPTX
- Slide Ratio 16:9
- Color
Keywords
About the Product
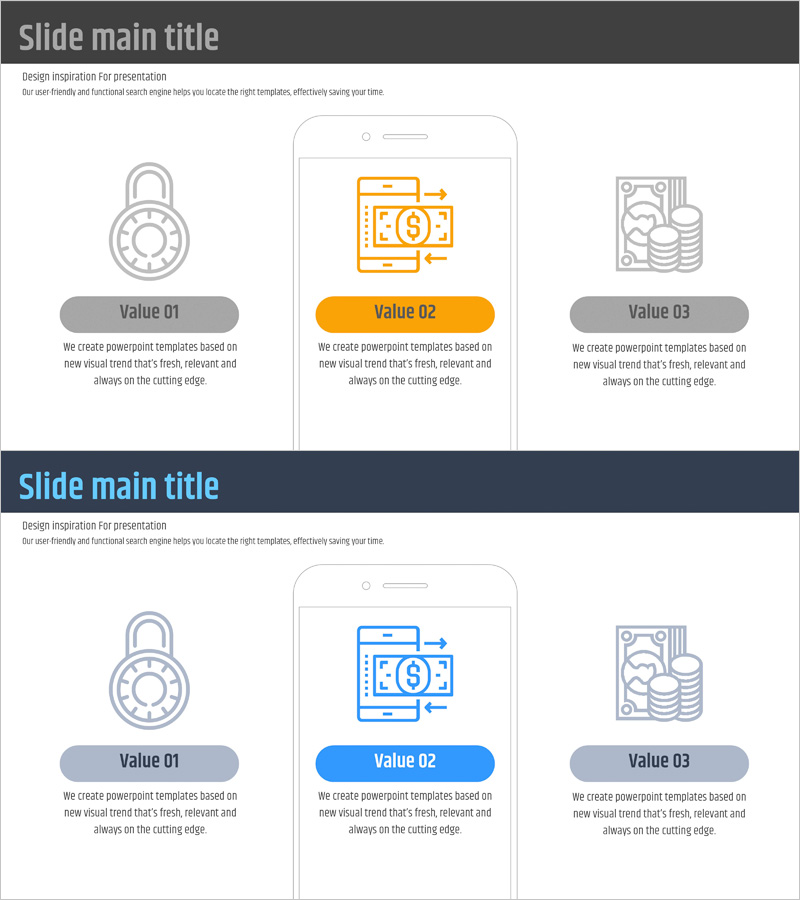
A cluster diagram PowerPoint slide that visualizes the three core characteristics of a fintech system through a central node layout. The design features a smartphone icon at the center, surrounded by three circular elements representing Security (padlock), Finance (banknote), and Technology (stacked coins), arranged in a radial pattern. The dual-tone color scheme of orange and blue conveys both financial reliability and technological innovation. Each element includes a text area below for detailed descriptions, and two slide variations (grayscale and blue tone) allow you to match your presentation's visual identity. Ideal for program introductions, technology explanations, and business model presentations.
Usage Points
-
Main Usage
Designed to explain the core value of fintech or financial technology solutions by classifying them into three axes (Security, Finance, Technology), making the system structure immediately clear to your audience. The central hub layout effectively demonstrates relationships between the main concept and supporting elements.
-
How to Use
Customize the text boxes beneath each circular element with specific descriptions (e.g., Security=encryption technology, Finance=payment systems, Technology=API integration) to match your presentation context. Choose between two slide variations (grayscale or blue background) to align with your overall presentation design theme.
-
Recommended For
Ideal for fintech startup pitches, financial technology solution proposals, digital banking platform introductions, blockchain and cryptocurrency project presentations, and IT company technology capability briefings. Perfect for presentations to executives, investors, and technical stakeholders requiring credible structural explanations.
-
Slide Structure
2-slide set. Each slide features a central smartphone icon with three circular nodes (Security, Finance, Technology) positioned at 120-degree intervals. Each node includes a text area below for descriptions. Slide 1 emphasizes orange tones while Slide 2 emphasizes blue tones, with identical layouts for consistent messaging.
Related Products
-

Cloud Smart System Program – Vision of Innovation
#Product/Service Introduction #Diagram #Features
-

Key Feature Diagram by Problem Type – Clear Feature Visualization
#Product/Service Introduction #Diagram #Features
-

Exercise Coaching Methods: Offline and Online – Choose Your Curriculum
#Product/Service Introduction #Diagram #Features
-

Introduction of Main Product Features – Visualizing Product Functions with Diagrams
#Product/Service Introduction #Diagram #Features
