Growth Comparison Mixed Chart – Market Trend Analysis
RM0400010_6
- Last Update 08/30/2025
- File Size 0.7MB
- # of Slides 2
- File Format PPTX
- Slide Ratio 16:9
- Color
Keywords
About the Product
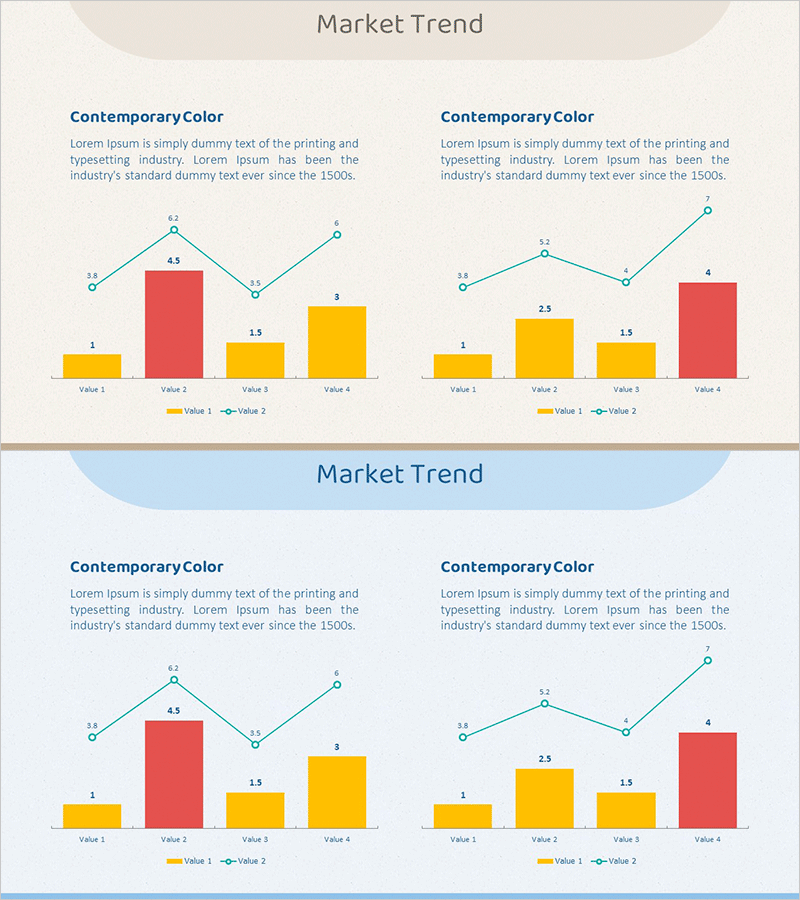
A mixed chart PowerPoint slide designed for market analysis and competitive comparison. This 2-slide set combines bar graphs and line charts with contrasting backgrounds—beige on the left, light blue on the right—for visual distinction. Each slide features four data entry points with yellow bars (Value 1) and teal lines (Value 2) to display two data series simultaneously. Ideal for visualizing business growth rates, market share, quarterly performance, and other numerical data. Ready to edit and insert into presentations and reports without additional design work.
Usage Points
-
Main Usage
Compare and analyze two data series—such as market conditions, competitor metrics, or business growth rates—simultaneously. The bar graph displays absolute values while the line chart shows trends, enabling audiences to grasp both magnitude and trajectory in a single view.
-
How to Use
Input different market or product data into the left and right slides for side-by-side comparison. Edit the text fields for Value 1 and Value 2 labels, enter numerical data, and update the chart data to reflect actual statistics. The template is fully customizable within PowerPoint.
-
Recommended For
Marketing plans, business reports, investor presentations (IR), quarterly performance reviews, and market research reports. Recommended for marketing professionals, business analysts, planners, and executives who need data-driven decision support.
-
Slide Structure
2-slide set. Each slide contains a title area (Contemporary Color), descriptive text section, four data input fields, a yellow bar graph, and a teal line chart. Left slide uses beige background; right slide uses light blue background for visual separation.
Related Products
-

Market Trend Analysis Mixed Chart – Capturing Data and Insights
#Market and Competitor Analysis #Graph #Other
-

Market Trend Analysis Mixed Graph & Table
#Market and Competitor Analysis #Diagram #Graph
-

Competitor Analysis Broken Line Graph – Visualizing Market Trends
#Market and Competitor Analysis #Graph #Other
-

Elderly Silhouette Area Diagram – Market Trend Analysis
#Market and Competitor Analysis #Graph #Other
