Income Statement Table Chart – Efficient Financial Analysis
RM0400005_28
- Last Update 02/15/2025
- File Size 3MB
- # of Slides 2
- File Format PPTX
- Slide Ratio 16:9
- Color
Keywords
About the Product
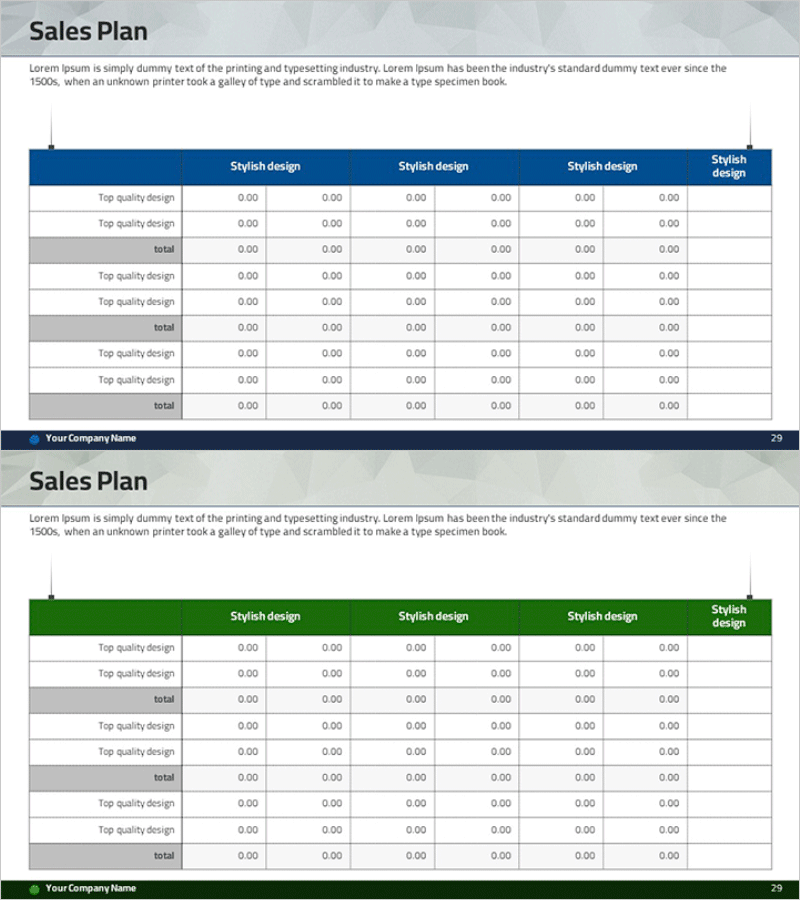
An essential income statement table PowerPoint slide for financial analysis and management reporting. The dark blue header and white background create clear contrast, organizing revenue, expenses, and profit items systematically across six columns and multiple rows. The two-slide set enables side-by-side comparison of diverse financial data, optimized for 16:9 widescreen presentations. Ideal for quarterly and annual performance reports, investor presentations, executive briefings, and business documents requiring structured financial visualization.
Usage Points
-
Main Usage
Visualizes financial performance data in a structured table format, clearly conveying the relationship between revenue, expenses, and profit items. Enhances data credibility and accelerates decision-making when comparing quarterly and annual financial results.
-
How to Use
Insert into quarterly or annual financial performance slides, or use in investor presentation (IR) materials to explain profit trends. Suitable for executive briefings, business plan financial projections, and earnings reports.
-
Recommended For
Accounting and finance teams, CFOs, financial analysts, executives, investor relations professionals, consulting firms, and financial institutions presenting accurate financial performance.
-
Slide Structure
Comprises a dark blue header row with six columns and white background data rows, with alternating light gray backgrounds for row distinction. Two-slide layout enables side-by-side comparison of financial data across multiple periods.
Related Products
-

Green Mint Organization Chart - Intuitive Team Introduction
#Company Introduction #Diagram #Organizational Chart
-

Business Work System Organization Chart – Maximizing Efficiency Structure
#Company Introduction #Technical Approach #Diagram
-

PowerPoint Template for Service Operation Strategy Presentation
#Business Management #Operational Plan #Technical Approach
-

Business Key Program Introduction Diagram
#Product/Service Introduction #Diagram #Program Introduction
