Market Segmentation Donut Chart – The Art of Data Visualization
RM0400004_7
- Last Update 02/15/2025
- File Size 2MB
- # of Slides 2
- File Format PPTX
- Slide Ratio 16:9
- Color
Keywords
- #Content-Based Slides
- #Design-Based Slides
- #Product/Service Introduction
- #Market and Competitor Analysis
- #Graph
- #Composition
- #Market Analysis
- #Circles
- #Doughnut Chart
- #16:9
- #donut chart PowerPoint
- #pie chart slide template
- #market segmentation visualization
- #data ratio chart
- #presentation graph template
- #how to create donut chart in PowerPoint
About the Product
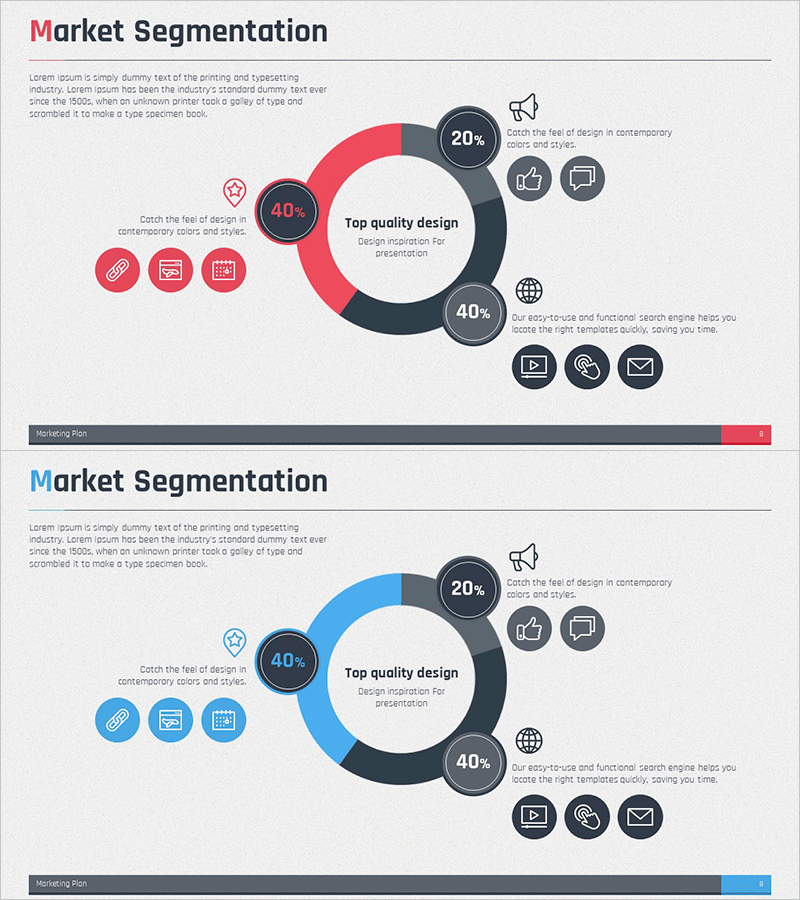
A donut chart PowerPoint slide that visualizes market segmentation data across three segments with contrasting red, blue, and gray color schemes. The center circular area provides space for key messaging, while surrounding icons and descriptive text reinforce the meaning of each segment. This presentation slide effectively communicates proportion relationships at a glance, making it ideal for business analysis and strategic planning. The 2-slide set includes color variations (red and blue themes) to match your brand guidelines. Delivered in 16:9 widescreen PPTX format, fully editable and ready to use immediately.
Usage Points
-
Main Usage
Display market size, customer composition, and revenue distribution as proportional data using a donut chart format. The center circular area highlights core messaging such as 'Top Quality Design,' drawing attention while emphasizing the hierarchical relationship with surrounding segments.
-
How to Use
Open the slide and replace the donut chart segment percentages with your actual data. Edit the center text and surrounding icons and descriptions to clarify the meaning of each segment. Choose between the two color variations (red or blue theme) that best matches your presentation tone.
-
Recommended For
Ideal for marketing strategy presentations, market analysis reports, business plans, investor pitch decks, and quarterly performance reviews explaining customer demographics, regional revenue distribution, and product category market share. Suitable for executive, sales, and marketing team presentations.
-
Slide Structure
2-slide set with identical donut chart layout and color variations (red theme and blue theme). Each slide features a center circular area, 3 segments (40%-40%-20% example), 3 surrounding icons, and descriptive text zones for customization.
Related Products
-

Health Checkup Data Analysis Circular Graph – Effective Business Data Visualization
#Product/Service Introduction #Market and Competitor Analysis #Diagram
-

Medical System Configuration Graph – Infographic for Market Analysis
#Product/Service Introduction #Market and Competitor Analysis #Diagram
-

Comparative Analysis of Composition Contents Pie Chart – Market and Competitor Analysis
#Product/Service Introduction #Market and Competitor Analysis #Graph
-

Oriental Medicine Component Circle Graph – Accurate Visualization of Market and Products
#Product/Service Introduction #Market and Competitor Analysis #Graph
