Key Financial Indicators Table Chart – Presentation for Funding Plan
RM0400003_27
- Last Update 02/15/2025
- File Size 3.6MB
- # of Slides 2
- File Format PPTX
- Slide Ratio 16:9
- Color
Keywords
- #Content-Based Slides
- #Design-Based Slides
- #Financial Plans and Performance
- #Diagram
- #Capital Requirements
- #Key Financial Indicators
- #Table
- #16:9
- #financial indicators table PowerPoint
- #funding plan presentation slide
- #financial data comparison table
- #investment pitch PowerPoint template
- #how to create financial table in PowerPoint
About the Product
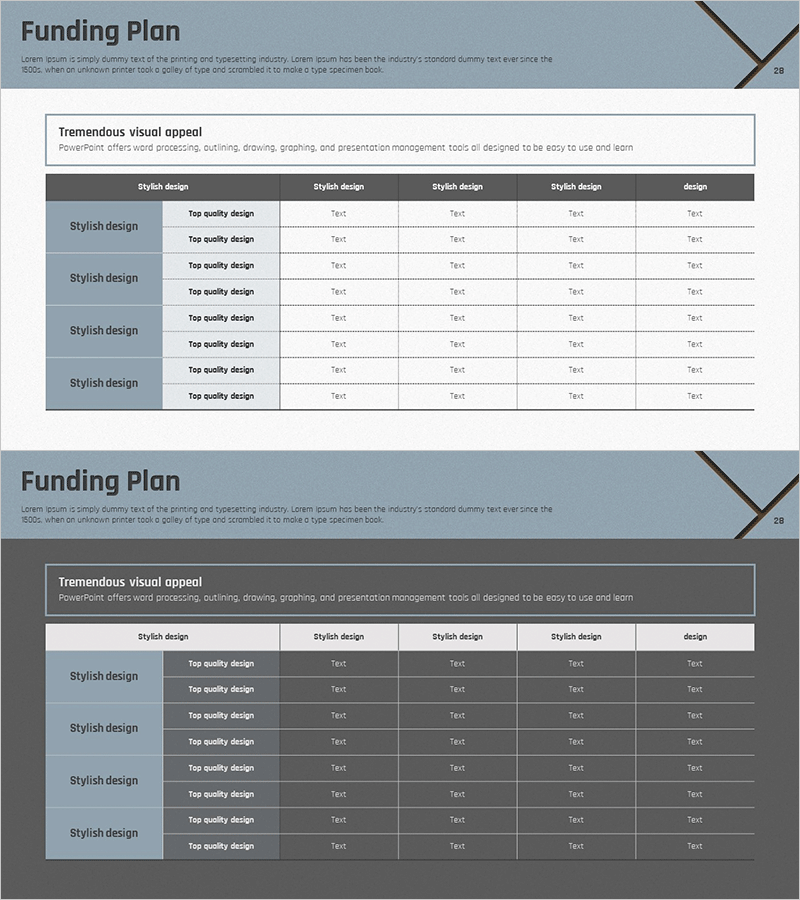
Essential financial indicators table PowerPoint slide for investment pitch and funding presentations. This 2-slide set visualizes key financial data including funding requirements, financial forecasts, and ROI in a clear tabular format. The blue header and gray background convey professionalism, while the 5-row × 5-column structure enables side-by-side comparison of multiple financial metrics. Ample text input areas allow you to enter actual figures and deploy the presentation immediately without additional design work.
Usage Points
-
Main Usage
Communicate key financial metrics clearly in investor presentations, funding proposals, and financial performance reports. Compare multiple financial items such as funding requirements, projected revenue, and break-even point simultaneously to support decision-making.
-
How to Use
Insert into the financial section of investor relations materials, business plans, or investment proposals. Enter actual figures into each cell and add or remove rows and columns as needed. Highlight specific table items during presentations to draw audience attention to critical data points.
-
Recommended For
CFOs, finance managers, investor relations specialists, startup founders, and business development professionals use this for funding pitches, financial reporting, and executive presentations. Suitable for all industries including finance, technology, and manufacturing.
-
Slide Structure
2-slide set with the first slide featuring a 5-row × 5-column table (including header) and the second slide a 4-row × 5-column table. Each cell accepts text input, with blue headers and gray backgrounds clearly distinguishing data hierarchy.
Related Products
-

Diagram for Visualizing Financial Plans – Grey Brown Design
#Financial Plans and Performance #Diagram #Capital Requirements
-

Funding Plan Table for Financial Planning Slide
#Financial Plans and Performance #Diagram #Capital Requirements
-

Curved Theme Purple Template Diagram – Key to Financial Planning
#Financial Plans and Performance #Diagram #Capital Requirements
-

Blue Green Table Analysis – Visualizing Financial Plans
#Financial Plans and Performance #Diagram #Capital Requirements
