Marketing Budget Analysis Table – Efficient Budget Allocation
RM0400001_26
- Last Update 02/14/2025
- File Size 0.4MB
- # of Slides 2
- File Format PPTX
- Slide Ratio 16:9
- Color
Keywords
- #Content-Based Slides
- #Design-Based Slides
- #Financial Plans and Performance
- #Diagram
- #Projected Return on Investment (ROI)
- #Budget
- #Table
- #16:9
- #marketing budget PowerPoint slide
- #budget analysis table slide
- #budget comparison PPT template
- #marketing budget management presentation
- #financial data table PowerPoint
About the Product
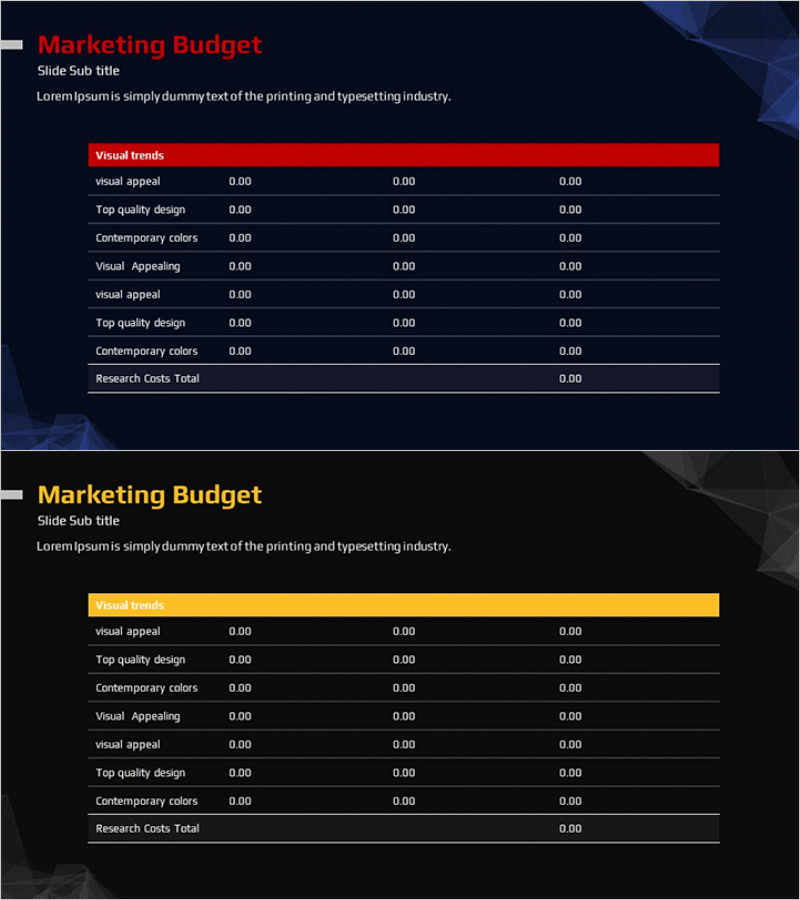
A professional PowerPoint slide for visualizing marketing budget allocation and ROI comparison in a clear, data-driven format. Featuring a dark navy background with red and yellow accent color variants, this slide presents budget categories in a 3-column structure (typically period-based comparison) for intuitive numerical analysis. Each row is fully editable, allowing you to add or modify budget line items directly. Perfect for marketing strategy presentations, financial reports, investor pitch decks, and quarterly budget reviews. The table layout emphasizes budget efficiency and supports executive decision-making with structured data visualization.
Usage Points
-
Main Usage
Communicate marketing budget allocation and spending efficiency to executives and investors through structured numerical comparison. The 3-column layout enables side-by-side budget analysis across periods or categories, providing clear evidence for financial decision-making and budget justification.
-
How to Use
Insert into the budget or financial section of marketing strategy presentations, quarterly financial reports, or investor pitch decks. Edit row labels and numerical values directly in the table, or copy-paste data from Excel spreadsheets for quick updates and consistency.
-
Recommended For
Marketing managers, financial analysts, CFOs, and business development professionals presenting budget performance and allocation strategies. Ideal for startup investor presentations, corporate marketing strategy reviews, quarterly earnings calls, and budget planning meetings.
-
Slide Structure
2-slide set featuring red accent and yellow accent color variants. Each slide includes a title area, category header section, 8 budget line items plus a total row, and a 3-column data entry table (typically for monthly, quarterly, or year-to-date comparisons) with fully editable cells.
Related Products
-

Potential and Plans for Attracting Additional Investment - Projected ROI and Strategic Budget Analysis
#Financial Plans and Performance #Diagram #Projected Return on Investment (ROI)
-

Marketing Budget Analysis Table – Optimized for Financial Performance
#Financial Plans and Performance #Diagram #Projected Return on Investment (ROI)
-

Expected Return on Investment Chart – Visualizing Financial Performance
#Financial Plans and Performance #Diagram #Projected Return on Investment (ROI)
-

Estimated Fund Requirements for Construction Projects – Clear Financial Planning
#Financial Plans and Performance #Diagram #Projected Return on Investment (ROI)
