KSF Critical Success Factors Circular Diagram
RM0400002_16
- Last Update 02/14/2025
- File Size 1MB
- # of Slides 2
- File Format PPTX
- Slide Ratio 16:9
- Color
Keywords
- #Content-Based Slides
- #Design-Based Slides
- #Product/Service Introduction
- #Business Vision and Strategy
- #Diagram
- #Composition
- #Core Competencies
- #Spread
- #Decentralized Diagram
- #16:9
- #KSF diagram PowerPoint
- #critical success factors slide
- #circular diagram template
- #3-node business diagram
- #strategy presentation PPT
- #how to create KSF diagram in PowerPoint
About the Product
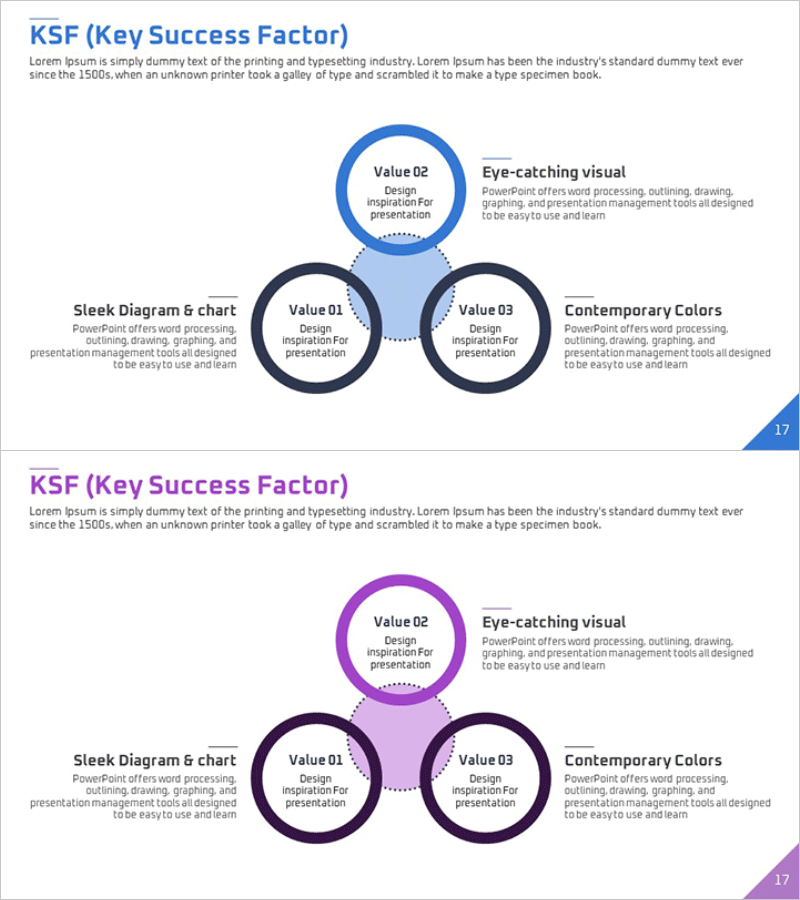
A three-node circular diagram PowerPoint slide designed to visualize Key Success Factors (KSF) in business strategy presentations. The diagram features a central primary value node (Value 02) positioned at the top, with two supporting factor nodes (Value 01 and Value 03) arranged symmetrically below, connected by dotted lines to show interdependencies. The slide uses a multi-color palette with blue, navy, and lavender circular nodes, complemented by a text description area on the right side for detailed explanations of each factor. Ideal for strategy presentations, executive briefings, and business planning sessions. The 2-slide set includes both blue and purple color variations, allowing you to match your presentation's visual identity and brand guidelines.
Usage Points
-
Main Usage
This diagram enables clear visual communication of an organization's Key Success Factors in strategic planning and executive presentations. By positioning the primary factor centrally and supporting factors symmetrically, it helps stakeholders quickly grasp strategic priorities and their relationships.
-
How to Use
Replace the placeholder text within each circular node with your specific KSF items. Add detailed descriptions in the right-side text area for each factor. Select either the blue or purple color version based on your presentation's brand color scheme and visual guidelines.
-
Recommended For
Ideal for C-suite executives, strategy teams, and business development professionals presenting corporate strategy, business plans, and investor pitches. Also effective for consulting reports, strategic planning workshops, and new business initiative presentations.
-
Slide Structure
The slide comprises three circular nodes arranged in a triangular layout: one primary node (Value 02) centered at the top, and two supporting nodes (Value 01 and Value 03) positioned symmetrically at the bottom. Dotted connecting lines indicate relationships between factors, with a dedicated text description area on the right for elaborating on each KSF element.
Related Products
-

KSF Circular Diagram – Visualizing Key Success Factors
#Product/Service Introduction #Business Vision and Strategy #Diagram
-

Global Business Critical Success Factors Analysis Diagram
#Product/Service Introduction #Business Vision and Strategy #Diagram
-

Slide for Effective Presentation of Medicinal Ingredients Composition
#Product/Service Introduction #Business Vision and Strategy #Diagram
-

Circular Diagram for Introduction and Characteristics – Emphasizing Business Impact
#Product/Service Introduction #Business Vision and Strategy #Operational Plan
