Global Network Distribution Analysis – Visualizing Market Strategy
RM0300021_11
- Last Update 02/12/2025
- File Size 0.5MB
- # of Slides 2
- File Format PPTX
- Slide Ratio 16:9
- Color
Keywords
About the Product
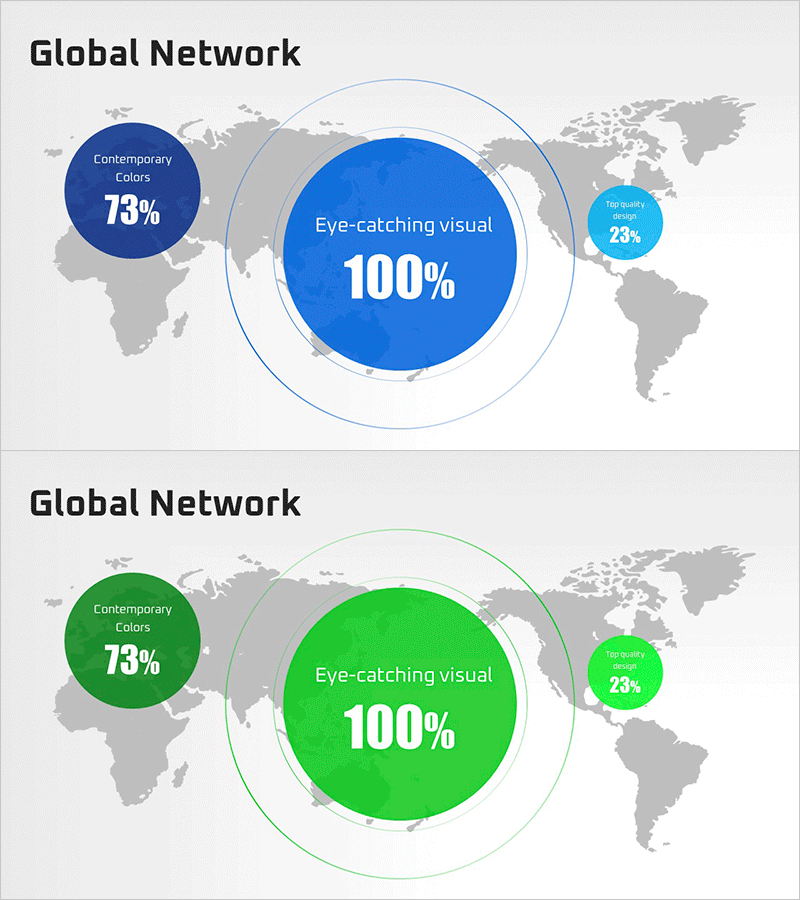
A 2-slide PowerPoint presentation visualizing global market strategy with world map and concentric circle structure. The layout features a world map with three-tier concentric circles highlighting key regions, complemented by two pie charts on the left and right sides displaying percentage data. Dual-tone blue and green color scheme conveys trust and growth simultaneously. Designed in 16:9 widescreen format for modern presentation environments, with fully editable text, numbers, and region labels. Ready-to-use slides for international business expansion, market entry planning, and global partnership presentations.
Usage Points
-
Main Usage
Visualizes global market strategy, regional business distribution, and international network status at a glance. The concentric circle structure clearly expresses the hierarchy between core and peripheral markets, while dual pie charts quantify regional proportions, performance, and targets to support strategic decision-making.
-
How to Use
Use in investor pitches, executive briefings, and partner meetings to explain global business status. Replace pie chart percentages with actual data, edit region names and legends to match company strategy, and deploy immediately as presentation material.
-
Recommended For
International business managers, marketing strategy teams, executives, and investor relations professionals explaining global market entry, regional performance, and international partnerships. Ideal for business plans, quarterly reports, and investment pitch decks.
-
Slide Structure
2-slide set: Slide 1 features blue-tone concentric map with left pie chart (73%) and right pie chart (23%); Slide 2 uses green-tone concentric map with identical layout. Each slide contains 1 title area, 1 map area, and 2 pie charts with clear text and data input zones.
Related Products
-

Country-by-country Yield Analysis Map for Global Business Strategy
#Company Introduction #Marketing Plan and Strategy #Graph
-

Startup Business Global Market Strategy – Market Analysis and Goal Setting
#Company Introduction #Marketing Plan and Strategy #Graph
-

Target Market Entry Analysis Graph
#Company Introduction #Marketing Plan and Strategy #Graph
-

Global Network Analysis Chart – Visualizing Target Market Strategy
#Company Introduction #Marketing Plan and Strategy #Graph
