Global Distribution Analysis Chart – Visualizing Marketing Strategies
RM0200012_7
- Last Update 02/04/2025
- File Size 0.9MB
- # of Slides 2
- File Format PPTX
- Slide Ratio 16:9
- Color
Keywords
- #Content-Based Slides
- #Design-Based Slides
- #Company Introduction
- #Marketing Plan and Strategy
- #Graph
- #Other
- #Global Network
- #Target Market Strategy
- #Map
- #16:9
- #global distribution map PPT
- #regional analysis PowerPoint slide
- #world map chart
- #marketing strategy visualization
- #global network presentation
About the Product
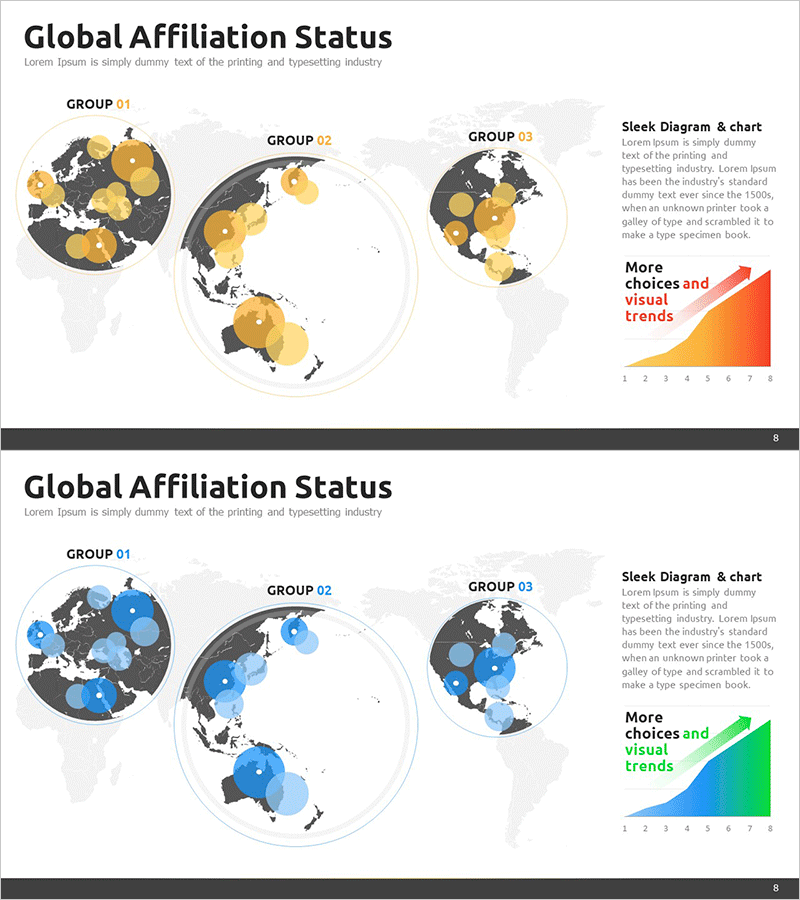
A 2-slide PowerPoint presentation for visualizing global market analysis and regional business distribution. The layout features a world map divided into three groups with circular charts, enabling quick regional data comparison. Two color versions—orange and blue—are included to match your presentation theme and brand identity. Text description areas and trend graphs are positioned on the right for clear information delivery. This slide deck is ready to use for marketing strategy presentations, investor pitches, and global network introductions.
Usage Points
-
Main Usage
Display global market status, regional business distribution, and target market analysis using both map and circular charts simultaneously. Communicate international business scope and regional performance clearly to investors, partners, and stakeholders.
-
How to Use
Enter region names and metrics (revenue, customer count, market share) in each GROUP area. Add analysis content in the right text box. Select your preferred color version to match presentation tone and update trend graph data to complete the slide.
-
Recommended For
Ideal for global marketing strategy presentations, international business briefings, investor pitch decks, regional sales reports, and global network introductions. Recommended for executive teams, marketing departments, and sales teams supporting strategic decision-making.
-
Slide Structure
Two-slide format with each slide containing three world map regions (GROUP 01, 02, 03), circular charts, right-side text description area, and trend graph. Optimized for 16:9 widescreen format in modern presentation environments.
Related Products
-

Country-by-country Yield Analysis Map for Global Business Strategy
#Company Introduction #Marketing Plan and Strategy #Graph
-

Global Network Analysis Chart – Visualizing Target Market Strategy
#Company Introduction #Marketing Plan and Strategy #Graph
-

Global Network Distribution Analysis – Visualizing Market Strategy
#Company Introduction #Marketing Plan and Strategy #Graph
-

Country-by-country Affiliate Status Analysis Graph – Global Network Strategy
#Company Introduction #Marketing Plan and Strategy #Graph
