Introducing Data-Driven Analytics Programs – Innovative Diagrams for Presentation
RM0300020_15
- Last Update 02/12/2025
- File Size 2.5MB
- # of Slides 2
- File Format PPTX
- Slide Ratio 16:9
- Color
Keywords
- #Content-Based Slides
- #Design-Based Slides
- #Product/Service Introduction
- #Diagram
- #Product/Service Introduction
- #Program Introduction
- #Cluster
- #Closed Cluster Diagram
- #16:9
- #closed-form diagram PowerPoint
- #data analytics presentation slide
- #hierarchical structure diagram
- #program introduction PPT
- #technology presentation template
About the Product
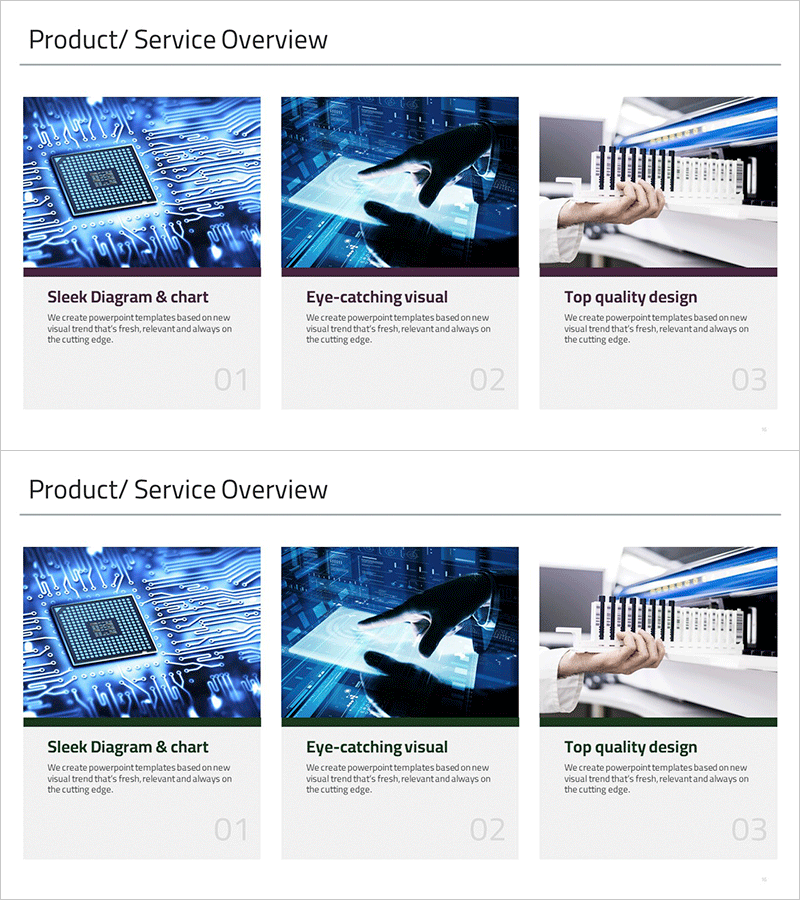
A closed-form diagram PowerPoint slide designed to introduce data-driven analytics programs with a clear hierarchical structure. The dark blue background with bright blue accent lines creates a professional presentation of a three-tier system architecture. This 2-slide deck is optimized for technology-focused presentations covering IT solutions, data analysis, and program innovation. Node connections are emphasized through arrows and icon elements, making complex system structures intuitive and easy to understand. The 16:9 widescreen format adapts seamlessly to modern presentation environments, and the fully editable PPTX format allows immediate customization for your specific content.
Usage Points
-
Main Usage
Visually explain hierarchical structures and step-by-step processes of data analytics programs, IT solutions, and technical systems. The closed-form node structure clearly expresses containment relationships and dependencies between elements, making complex technical concepts accessible and understandable to audiences.
-
How to Use
Use in technology-focused presentations, product introduction decks, and business plan technical sections to explain program architecture or data processing workflows. Edit node text to customize with actual program components or analysis stages relevant to your specific presentation context.
-
Recommended For
Recommended for IT companies, data analytics firms, software development teams, and technology consulting firms. Ideal for executives, technical leads, and sales teams presenting technical solutions to investors, clients, and internal stakeholders. Perfect when complex system structures need to be communicated clearly and concisely.
-
Slide Structure
2-slide deck featuring a 3-level closed-form diagram on the first slide with central core element and upper-middle-lower tier arrangement, and a variant layout on the second slide. Dark blue background with bright blue accent lines, arrows, and icons express node relationships and system connections.
Related Products
-

Summer Vacation Template Closure Diagram – Capture the Joy of Summer
#Product/Service Introduction #Diagram #Product/Service Introduction
-

Sofa Diagram Visualization – Stylish Design
#Product/Service Introduction #Diagram #Product/Service Introduction
-

Business Program Introduction Diagram
#Product/Service Introduction #Diagram #Product/Service Introduction
-

Mint Yellow Tree Structure - Intuitive Data Visualization
#Product/Service Introduction #Diagram #Product/Service Introduction
