Interior Business Program Features – Design and Impact
RM0300018_18
- Last Update 02/11/2025
- File Size 0.5MB
- # of Slides 2
- File Format PPTX
- Slide Ratio 16:9
- Color
Keywords
- #Content-Based Slides
- #Design-Based Slides
- #Product/Service Introduction
- #Diagram
- #Features
- #Program Introduction
- #Cluster
- #Closed Cluster Diagram
- #16:9
- #cluster diagram PowerPoint
- #5-item diagram slide
- #radial diagram template
- #business diagram PowerPoint
- #how to create cluster diagram in PowerPoint
About the Product
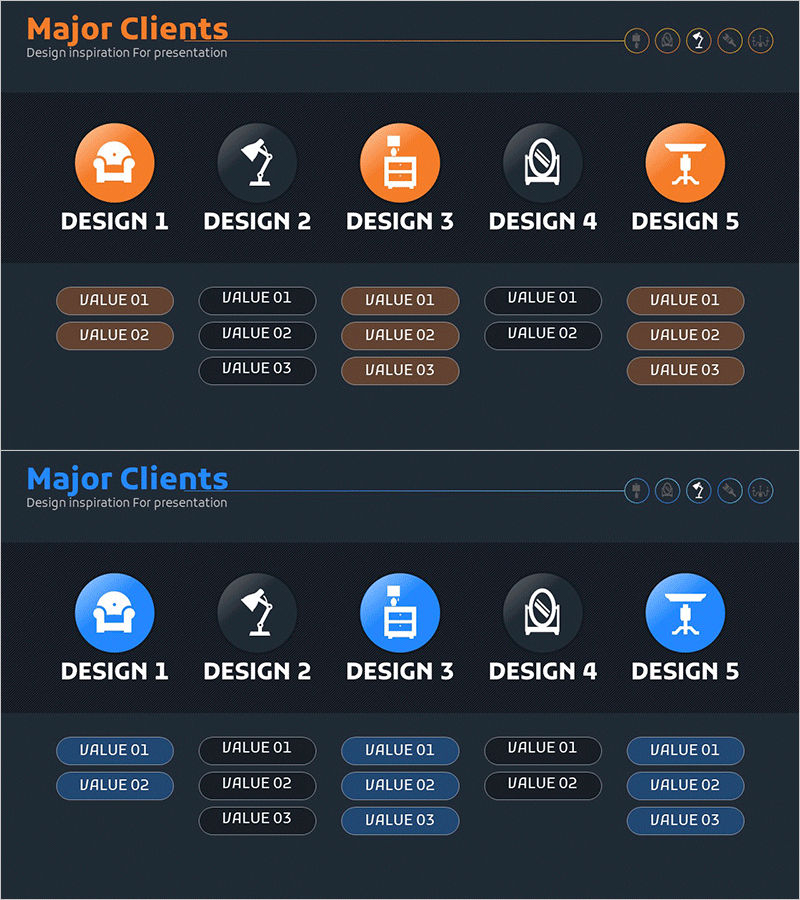
A radial cluster diagram PowerPoint slide featuring five items connected from a central hub in a spoke pattern. Designed with orange and blue dual-tone color scheme, each item includes 2-3 sub-value input areas for detailed information. This slide template is ideal for visualizing business program features, service categories, organizational functions, product lineups, and comparative analysis of five key elements. Provided as a 2-slide set in 16:9 widescreen format with fully editable text and icons.
Usage Points
-
Main Usage
Visualizes relationships and hierarchies among five key items at a glance. The radial structure radiates from a central concept to five directions, making it perfect for presenting business program features, service lineups, organizational functions, and product categories in a systematic and visually clear manner.
-
How to Use
Enter category names in each circular icon area and add detailed content in the 2-3 value boxes below. Use the orange and blue color contrast to differentiate items, or unify colors as needed. During presentations, explain each item sequentially or present the entire structure at once for comprehensive understanding.
-
Recommended For
Ideal for business plans, company profiles, product portfolios, marketing strategy presentations, organizational structure explanations, and service lineup introductions. Suitable for executives, marketing professionals, business development teams, and consultants who need to communicate complex information clearly and concisely.
-
Slide Structure
Consists of 2 slides, each featuring a radial structure with five items extending from a central hub. Each item includes 2-3 input areas (value boxes) allowing representation of 10-15 total data points. Orange-blue dual-tone colors and circular icons create visual hierarchy and clear differentiation.
Related Products
-

Closed-Box System Model – Effective Product Introduction via Diagram
#Product/Service Introduction #Diagram #Features
-

Cluster Slide for Travel Destination Analysis – Data Visualization
#Product/Service Introduction #Diagram #Features
-

Exercise Coaching Methods: Offline and Online – Choose Your Curriculum
#Product/Service Introduction #Diagram #Features
-

Ringer Shape Subdivided Column Graph for Program Introduction – Clustered Data Visualization
#Product/Service Introduction #Diagram #Features
