Cluster Slide for Travel Destination Analysis – Data Visualization
RJ0600085_8
- Last Update 07/13/2025
- File Size 0.8MB
- # of Slides 2
- File Format PPTX
- Slide Ratio 16:9
- Color
Keywords
- #Content-Based Slides
- #Design-Based Slides
- #Product/Service Introduction
- #Diagram
- #Features
- #Program Introduction
- #Cluster
- #Closed Cluster Diagram
- #16:9
- #cluster diagram PowerPoint
- #3-item closed cluster slide
- #travel destination analysis presentation
- #data visualization slide
- #business value presentation PPT
About the Product
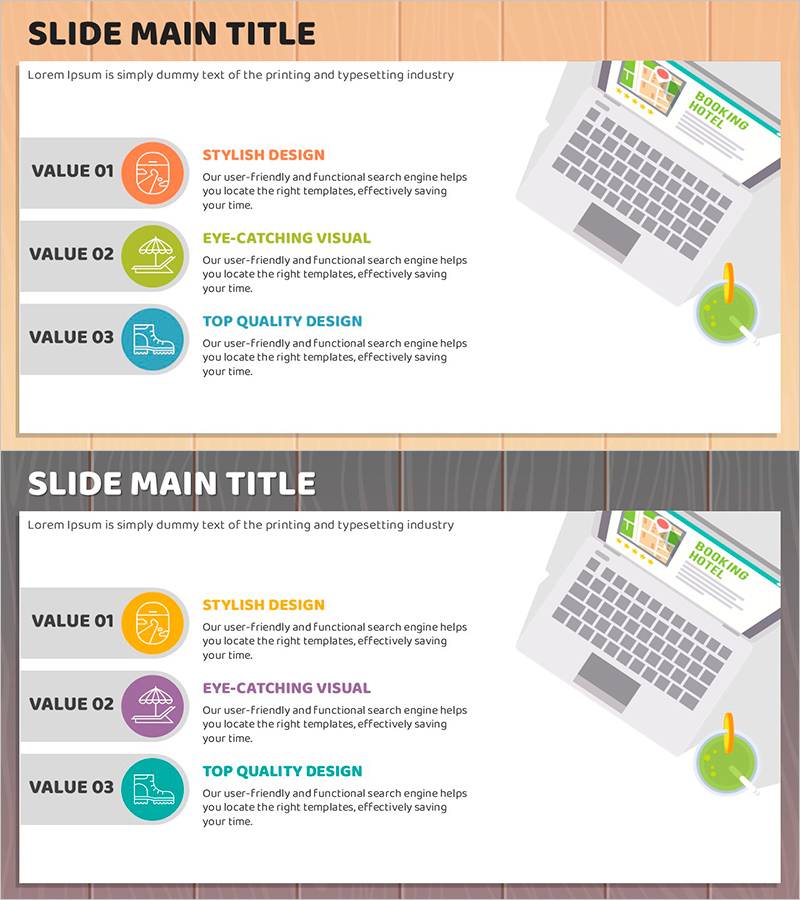
A 3-item closed cluster PowerPoint slide designed for travel destination analysis and business value presentation. Each item is highlighted with orange, green, and blue circular icons, featuring a left text area and right image area for balanced information delivery and visual impact. Provided in 16:9 widescreen PPTX format with 2 slides, ready for immediate editing. Ideal for travel, tourism, marketing, and strategy presentations. Customize text descriptions and icons to fit various business contexts and audience needs.
Usage Points
-
Main Usage
Visually organize and explain three key elements such as travel destination features, business values, or core strengths. The closed cluster structure emphasizes both independence and relationship between items, while the left-right layout clearly separates text information from visual elements.
-
How to Use
Use in travel and tourism marketing presentations to introduce destination highlights (style, visual appeal, quality). Apply in business strategy presentations to emphasize three core values, or in product introduction slides to explain key features. Simply replace icons and text with your own content for immediate presentation use.
-
Recommended For
Travel agencies, tourism boards, hotel marketing teams, business strategists, product managers, marketing professionals, consulting firms, and educators who need to structure key messages into three distinct categories for audience engagement.
-
Slide Structure
2-slide set with title area at top, left side featuring three items (VALUE 01, 02, 03) with text boxes, and right side image area. Each item includes orange, green, and blue circular icons for visual distinction. 16:9 widescreen format optimized for modern presentation environments.
Related Products
-

Overview of Children's Learning Areas – Visualizing Diverse Learning Domains
#Product/Service Introduction #Diagram #Features
-

Cloud Smart System Program – Vision of Innovation
#Product/Service Introduction #Diagram #Features
-

UX UI Program Introduction Slides – Modern Design and Visual Appeal
#Product/Service Introduction #Diagram #Features
-

Cluster Diagram Slide Visualizing Technical Characteristics
#Product/Service Introduction #Diagram #Other
