System Configuration Diagram for Each Business Step
RM0200016_20
- Last Update 02/06/2025
- File Size 0.3MB
- # of Slides 2
- File Format PPTX
- Slide Ratio 16:9
- Color
Keywords
- #Content-Based Slides
- #Design-Based Slides
- #Business Strategy
- #Business Management
- #Technical Approach
- #Diagram
- #Step-by-Step Schedule Plan
- #System Architecture Diagram
- #Flow
- #Structure
- #Linear Flow
- #Pyramid Chart
- #16:9
- #5-step flow diagram PowerPoint
- #business process diagram slide template
- #system configuration chart
- #timeline diagram PowerPoint
- #step-by-step structure slide
About the Product
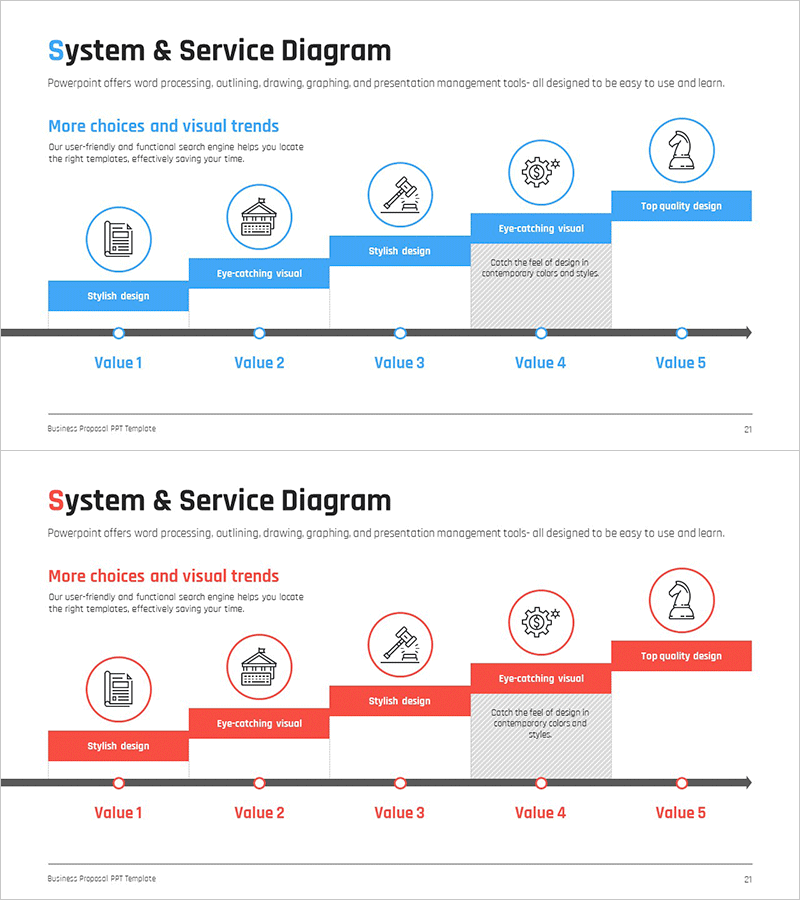
A 5-step linear flow diagram PowerPoint slide that visualizes business processes and system configuration by stage. Each step is represented as a circular node with icons and text labels along a horizontal timeline, available in both blue and red color schemes. This 16:9 widescreen 2-slide presentation template is ready to use for technology briefings, strategy presentations, and system architecture discussions.
Usage Points
-
Main Usage
Visualize business processes and system configurations in sequential order to communicate technical architecture, project phases, and business roadmaps clearly to audiences. The timeline-based structure emphasizes sequential flow, with each stage represented by icons and descriptive text.
-
How to Use
Use in technology presentations, business planning sessions, and system implementation roadmap discussions. Customize node text and icons to match your specific process, and select either the blue or red color version based on your presentation theme and audience context.
-
Recommended For
IT technical teams, business strategists, product development leaders, management consultants, and educators explaining system architecture, project phases, or business workflows. Suitable for technology seminars, executive briefings, client proposals, and internal training materials.
-
Slide Structure
2-slide set. Each slide features 5 circular nodes positioned along a horizontal gray timeline, with icons inside nodes and text labels (Value 1–5) below. Descriptive text boxes with design elements and icons are placed above each node section. Both blue and red versions maintain identical structural layout for consistent visual communication.
Related Products
-

Fintech Promotion Plan Diagram – Structured Visualization of Business Strategy
#Business Strategy #Business Management #Diagram
-

3 Step Delivery Process – Efficiency in Logistics Management
#Business Strategy #Business Management #Diagram
-

Activity Plan Structure Diagram – Effective Business Management
#Business Management #Technical Approach #Diagram
-

Three-dimensional Box Diagram – Visualization of Business Strategy
#Business Strategy #Diagram #Production Plan
