Feedback Evaluation Table – Visualization of Customer Success Cases
RM0200016_17
- Last Update 02/06/2025
- File Size 0.3MB
- # of Slides 2
- File Format PPTX
- Slide Ratio 16:9
- Color
Keywords
- #Content-Based Slides
- #Design-Based Slides
- #Financial Plans and Performance
- #Customer Success Stories
- #Diagram
- #Key Financial Indicators
- #Customer Testimonials and Feedback
- #Table
- #16:9
- #feedback evaluation table PowerPoint
- #customer success case slide
- #evaluation table design
- #business performance data visualization
- #how to create feedback table in PowerPoint
About the Product
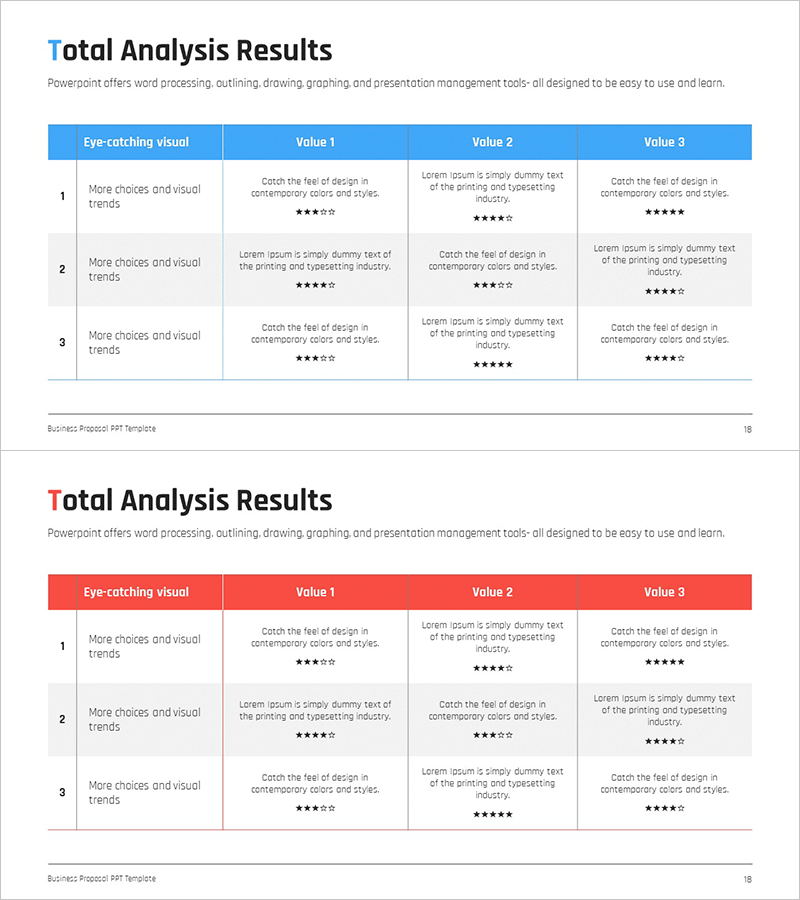
A 2-slide PowerPoint presentation designed to visualize customer success cases and feedback evaluations. The table layout features a blue header row and three data rows, optimized for organizing evaluation items and ratings. Each cell accommodates text and star rating icons, enabling simultaneous display of qualitative and quantitative assessments. Ready-to-use slides for presentations, reports, and performance analysis documents.
Usage Points
-
Main Usage
Organize customer feedback, evaluation results, and success cases in a structured table format to present decision-making evidence clearly. Combine qualitative opinions with quantitative scores for comprehensive performance analysis.
-
How to Use
Enter customer names, evaluation items, comments, and ratings in each row to display feedback status at a glance. Use in report customer success sections, performance evaluation pages, and investor presentation materials for credible data representation.
-
Recommended For
Customer success managers, marketing teams, sales directors, and executives preparing performance reports benefit from organizing customer satisfaction, product evaluations, and service improvement insights. Ideal for NPS analysis, product feedback collection results, and customer recommendation tracking.
-
Slide Structure
Two-slide set with identical table structure: blue header row (4 columns: Customer, Item, Comment, Rating) and 3 data rows. Each cell supports text input with star rating icons for intuitive evaluation level representation.
Related Products
-

Table for Financial Planning Analysis – Customer Success Case
#Financial Plans and Performance #Customer Success Stories #Diagram
-

Liquor Industry Financial Indicators – Effective Data Visualization
#Financial Plans and Performance #Diagram #Cash Flow Statement
-

Introduction to Penguin Key Financial Indicators – Blue Green Diagram
#Financial Plans and Performance #Diagram #Key Financial Indicators
-

Aurora Camping Business Key Financial Indicator Table
#Financial Plans and Performance #Diagram #Budget
