Table for Financial Planning Analysis – Customer Success Case
RM0200015_17
- Last Update 02/05/2025
- File Size 0.8MB
- # of Slides 2
- File Format PPTX
- Slide Ratio 16:9
- Color
Keywords
- #Content-Based Slides
- #Design-Based Slides
- #Financial Plans and Performance
- #Customer Success Stories
- #Diagram
- #Key Financial Indicators
- #Customer Testimonials and Feedback
- #Table
- #16:9
- #financial analysis table PowerPoint
- #financial planning slide design
- #comparison data table template
- #customer success case table
- #financial report slide
- #how to create financial data visualization in PowerPoint
About the Product
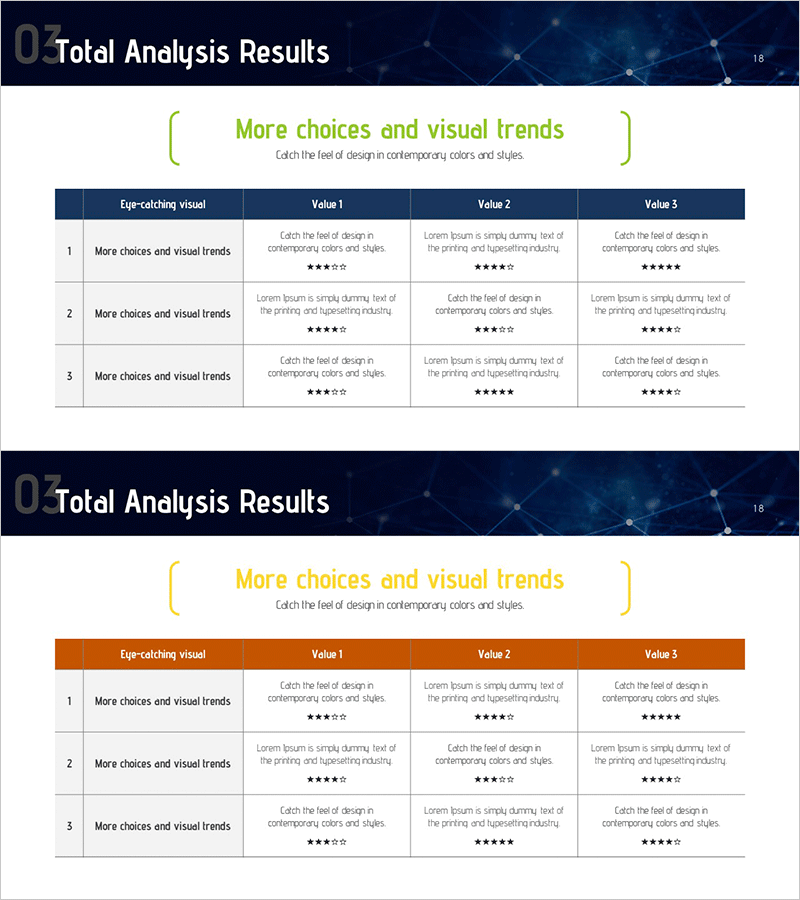
A 2-slide PowerPoint presentation for financial planning analysis and customer success case visualization. Features a dark blue header with white background and 3-column comparison table layout to clearly present financial data and performance metrics. The first slide displays a 'More choices and visual trends' title with three value columns (Value 1, Value 2, Value 3) in a structured table format, while the second slide offers an orange header variant of the same layout. Each cell includes text descriptions and star rating elements, making it immediately ready for investor, stakeholder, and executive presentations. 16:9 aspect ratio, fully editable PPTX format.
Usage Points
-
Main Usage
Visualizes financial metrics, performance data, and customer success cases in a 3-column comparison structure to clearly communicate financial status and achievements to investors, executives, and stakeholders. Supports data-driven decision-making with professional table design.
-
How to Use
Use in IR materials, financial reports, and business performance presentations to compare and analyze financial indicators, ROI, customer satisfaction scores, and other metrics across three categories. Edit the text and star ratings in each cell to input your actual data for a polished financial analysis slide.
-
Recommended For
CFOs, financial managers, investment officers, and executives presenting financial performance, customer satisfaction metrics, and business KPIs. Ideal for quarterly and annual financial reports, investor pitch decks, shareholder meetings, and board presentations.
-
Slide Structure
2-slide set. Slide 1: Dark blue header + 3-column comparison table (Eye-catching visual, Value 1–3 columns) + 3 data rows (text + star ratings). Slide 2: Orange header with identical structure. Each cell features independently editable text boxes and star rating graphics for flexible customization.
Related Products
-

Feedback Evaluation Table – Visualization of Customer Success Cases
#Financial Plans and Performance #Customer Success Stories #Diagram
-

Liquor Industry Financial Indicators – Effective Data Visualization
#Financial Plans and Performance #Diagram #Cash Flow Statement
-

Table of Major Financial Indicators – Optimized for Performance Analysis
#Financial Plans and Performance #Diagram #Budget
-

Introduction to Penguin Key Financial Indicators – Blue Green Diagram
#Financial Plans and Performance #Diagram #Key Financial Indicators
