Service Composition Diffusion Diagram – Presenting Technology Sector
RM0200015_23
- Last Update 02/05/2025
- File Size 2.8MB
- # of Slides 2
- File Format PPTX
- Slide Ratio 16:9
- Color
Keywords
- #Content-Based Slides
- #Design-Based Slides
- #Company Introduction
- #Technical Approach
- #Diagram
- #Business Areas
- #Service Architecture Diagram
- #Spread
- #Decentralized Diagram
- #16:9
- #radial diffusion diagram PowerPoint
- #service composition slide
- #5-node diagram
- #center diffusion PPT slide
- #technology sector diagram
- #how to create diffusion diagram in PowerPoint
About the Product
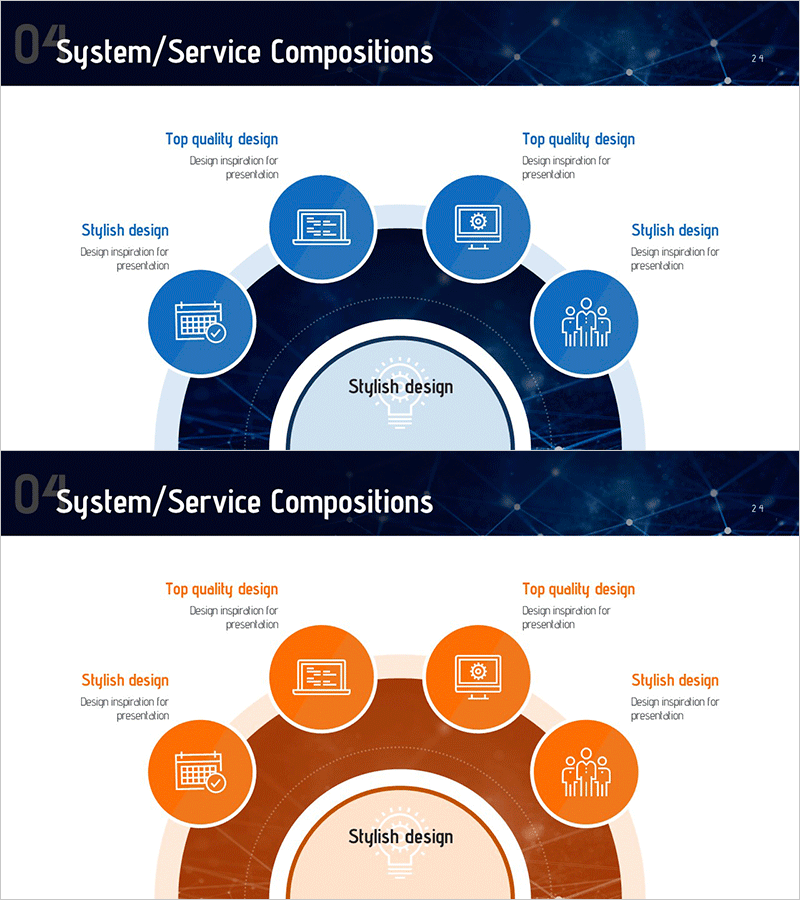
A radial diffusion diagram PowerPoint slide with five nodes expanding outward from a central concept. Set against a dark blue background, five bright blue circular nodes connect toward the center, ideal for expressing service composition, technology sectors, and organizational roles in a hierarchical structure. Each node includes an icon (laptop, monitor, calendar, settings, team) with editable text areas. The 2-slide set provides both blue and orange color versions, allowing you to match your presentation's tone. Ready to use immediately for presentations, business explanations, technology introductions, and various speaking scenarios.
Usage Points
-
Main Usage
Visualizes relationships where a central concept expands to surrounding elements. Ideal for expressing five equal-level items such as service composition, technology sectors, organizational roles, or business areas. Place the core message in the center and detailed content in surrounding nodes for hierarchical information delivery.
-
How to Use
Use at the beginning of presentations to introduce overall structure, or in technology, business plan, and organizational sections to explain relationships between key elements. Edit node text and icons to match your presentation topic. Blue tone emphasizes technology, IT, and trust; orange tone emphasizes energy, creativity, and innovation.
-
Recommended For
Recommended for IT and technology companies explaining technical architecture, consulting firms presenting business structure, startups introducing service ecosystems, enterprises describing organizational roles, and educational institutions outlining program composition. Suitable for executive reports, investor pitches, client proposals, and internal training materials.
-
Slide Structure
Composed of one central circular node plus five surrounding nodes (two at top, one at left, two at right). Each node is a bright blue circle with white border, connected to the center with dotted lines. Each node contains an icon and editable text area. Background features dark blue gradient to make nodes stand out.
Related Products
-

Business Service Components – Centerless Radial Diagram
#Company Introduction #Technical Approach #Diagram
-

Business Area Focused Diagram – Service Composition in Technology Sector
#Company Introduction #Technical Approach #Diagram
-

Diagram Slide for Interior Work Strategy
#Company Introduction #Business Introduction #Diagram
-

Service System Diagram – Visualizing the Core Structure of Business
#Company Introduction #Product/Service Introduction #Diagram
