Business Area Focused Diagram – Service Composition in Technology Sector
RM0200011_23
- Last Update 02/04/2025
- File Size 0.3MB
- # of Slides 2
- File Format PPTX
- Slide Ratio 16:9
- Color
Keywords
- #Content-Based Slides
- #Design-Based Slides
- #Company Introduction
- #Technical Approach
- #Diagram
- #Business Areas
- #Service Architecture Diagram
- #Cluster
- #Spread
- #Chain Diagram
- #Decentralized Diagram
- #16:9
- #radial diagram PowerPoint
- #business area presentation slide
- #6-node structure diagram
- #center-to-periphery diagram PPT
- #service composition template
About the Product
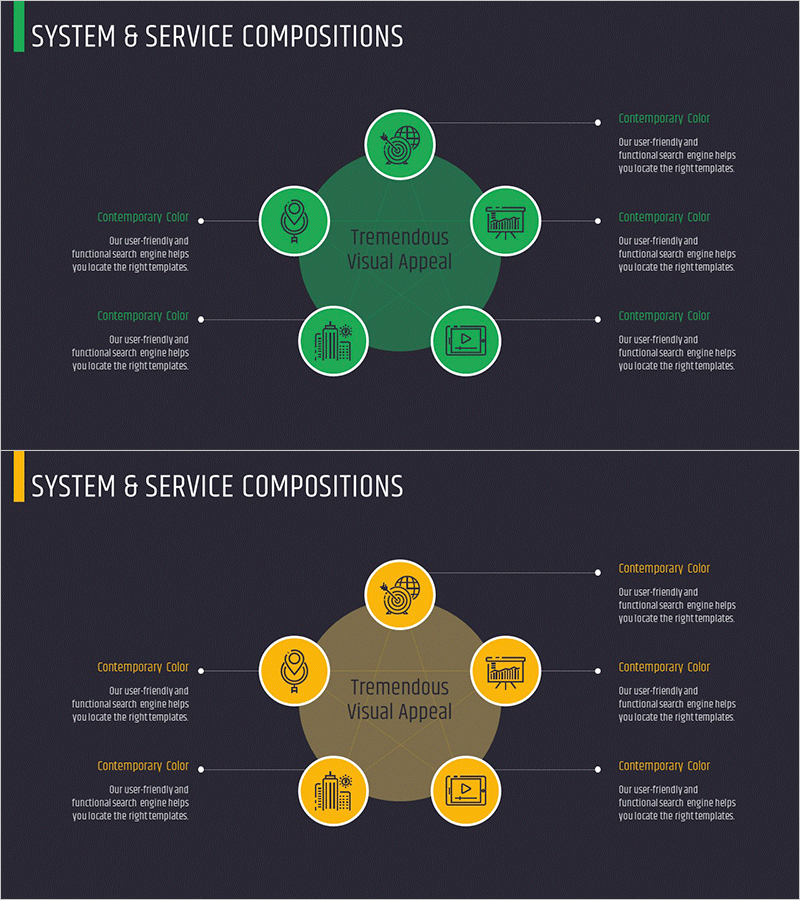
A radial diagram PowerPoint slide that expands from a central concept to six key business areas. Designed with a dark background and circular nodes in bright green or golden yellow, each node features an icon and text label. This presentation template visualizes business domains, technology sectors, and service compositions by placing the core concept at the center and showing relationships with six surrounding elements. The 2-slide set offers multiple color combinations and is fully editable in PPTX format for immediate use.
Usage Points
-
Main Usage
This slide effectively communicates an organization's core business areas and service composition across departments in a single view. It's ideal for strategy presentations and organizational structure explanations, showing how technology, marketing, operations, and other key functions relate to the central business concept.
-
How to Use
Use this template for company strategy presentations, organizational restructuring explanations, and business model introductions. Simply replace the center text and six node labels with your organization's actual department names, and swap the icons with images representing each business area.
-
Recommended For
Perfect for executive reports, business plans, organizational overviews, technology strategy presentations, and service portfolio descriptions. Particularly effective for IT companies, consulting firms, and large organizations explaining structural and functional divisions.
-
Slide Structure
The 2-slide set provides two color themes: emerald green and golden yellow. Each slide features a central concept with six circular nodes positioned at top, top-left, bottom-left, bottom, bottom-right, and top-right. Each node contains a white-bordered circle with an icon and text label, connected to the center by lines that represent relationships and hierarchical flow.
Related Products
-

Marketing Detail Plan Diagram – Strategic Tool for Business Initiatives
#Company Introduction #Business Strategy #Diagram
-

Business Service Components – Centerless Radial Diagram
#Company Introduction #Technical Approach #Diagram
-

Internet of Things Service Area Diagram – Business Introduction and Visualization
#Company Introduction #Business Introduction #Diagram
-

Financial Business Triangle Diagram – Visualization of Business Areas
#Company Introduction #Business Introduction #Diagram
