System Services Component Diagram – Clear Information Delivery through Clusters and Connections
RM0200012_23
- Last Update 02/04/2025
- File Size 0.7MB
- # of Slides 2
- File Format PPTX
- Slide Ratio 16:9
- Color
Keywords
- #Content-Based Slides
- #Design-Based Slides
- #Company Introduction
- #Technical Approach
- #Diagram
- #Business Areas
- #Service Architecture Diagram
- #Cluster
- #Chain Diagram
- #16:9
- #cluster diagram PowerPoint
- #system architecture slide
- #node connection diagram
- #service composition PPT
- #how to create system diagram in PowerPoint
- #6-node cluster slide template
About the Product
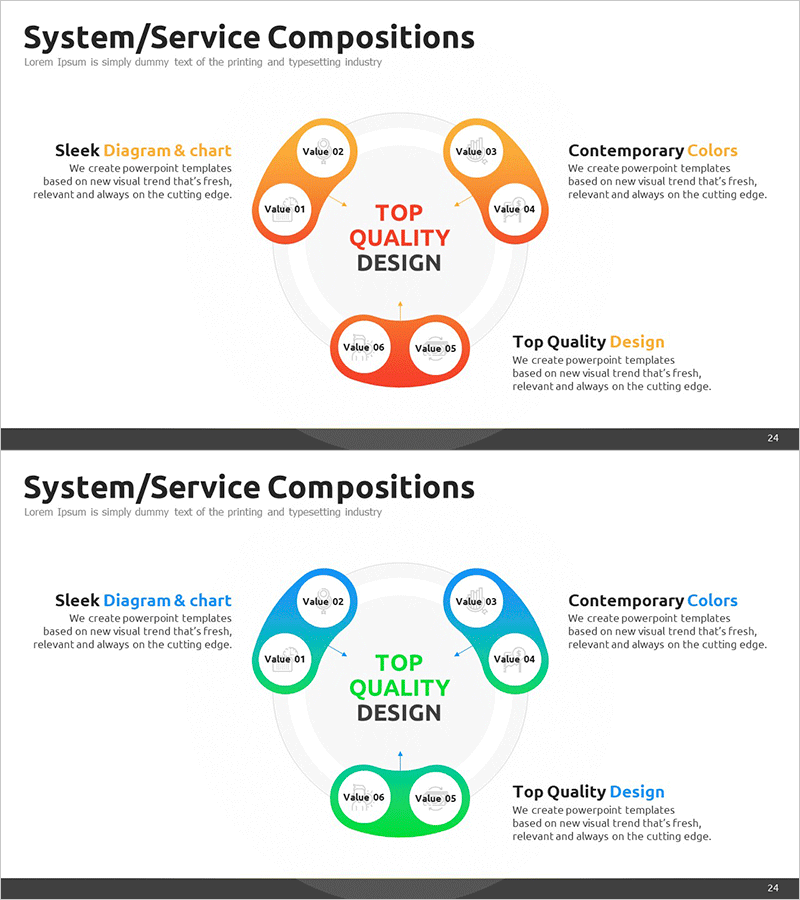
A PowerPoint slide that visualizes system and service components using a 6-node cluster connection structure. Circular nodes arranged around a central core message are connected by arrows and lines, clearly illustrating relationships and interactions between elements. Available in two color versions—orange and green—with editable labels and description text in each node. Instantly applicable for company vision presentations, service architecture explanations, and system overview slides in business proposals and pitch decks.
Usage Points
-
Main Usage
Explain organizational system and service components hierarchically, visually communicating connections and interactions between elements. The structure radiates from a central core message to surrounding elements, helping audiences intuitively understand complex systems and their interdependencies.
-
How to Use
Enter department names, functions, or service titles in each node, and place the core topic in the center. Add descriptive text on the left side and supplementary information on the right to explain the overall composition. Customize colors to match your brand identity and presentation style.
-
Recommended For
IT professionals, system architects, business strategists, and marketing managers explaining service structures, system compositions, or organizational hierarchies. Suitable for company introductions, product presentations, business plans, technical proposals, and strategic overview presentations.
-
Slide Structure
2-slide set. Each slide features 1 central circular node, 4 surrounding nodes (top, bottom, left, right), and 2 merged nodes at the bottom—6 nodes total connected by arrows and lines. Text areas on left and right sides allow for detailed explanations. Provided in orange and green color themes for flexible customization.
Related Products
-

Business Area Focused Diagram – Service Composition in Technology Sector
#Company Introduction #Technical Approach #Diagram
-

Cloud System Service Configuration Diagram – Modern Design and Visual Appeal
#Technical Approach #Diagram #Service Architecture Diagram
-

Question Mark Shape Diagram – Visualizing Business Areas and Connections
#Company Introduction #Business Introduction #Diagram
-

Business Investment Service Differentiation Strategy – Ringer Shape Subdivided Column Graph
#Product/Service Introduction #Technical Approach #Diagram
