Introduction to Business Services – System and Service Diagram
RM0200011_20
- Last Update 02/04/2025
- File Size 1MB
- # of Slides 2
- File Format PPTX
- Slide Ratio 16:9
- Color
Keywords
- #Content-Based Slides
- #Design-Based Slides
- #Business Management
- #Technical Approach
- #Diagram
- #Service Development Plan
- #System Architecture Diagram
- #Cluster
- #Chain Diagram
- #16:9
- #system diagram PowerPoint
- #service structure slide
- #connected flow diagram
- #business process presentation
- #service introduction template
About the Product
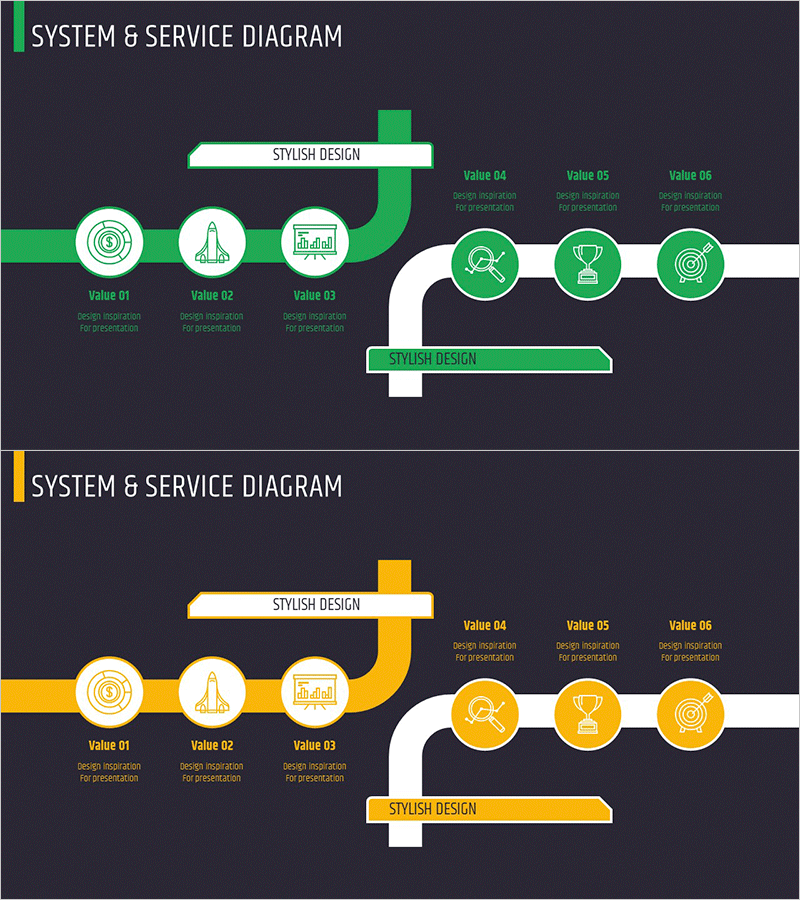
A connected-flow diagram PowerPoint slide that visually illustrates business and service system structures. The slide features six circular nodes—three on the left (Design Monitoring, Development Monitoring, Data Monitoring) and three on the right (Search, Achievement, Target)—linked by directional arrows to show process relationships and service flow. Each node includes an icon and text label for clarity. Two color versions (green and yellow) are included, allowing flexible branding options. The 16:9 widescreen format contains 2 fully editable slides suitable for business presentations, strategic planning, service development briefings, and organizational communications.
Usage Points
-
Main Usage
Designed to present business and service system structures with clear node-to-node relationships at a glance. The diagram connects design, development, and data monitoring phases with search, achievement, and goal-attainment processes, creating a comprehensive visual representation of service flow.
-
How to Use
Use as a system architecture slide in company introduction or service development planning presentations. Incorporate into business strategy meetings to explain process workflows. Edit node text and icons to match your specific content and create a customized diagram aligned with your presentation narrative.
-
Recommended For
Ideal for IT and software company technical presentations, service planning team process explanations, executive reports, investment pitch decks, and consulting firm strategy proposals. Frequently used by systems engineers, product managers, and business development professionals.
-
Slide Structure
Comprises 2 slides, each featuring 6 circular nodes (3 left, 3 right) connected by directional arrows with a label box at the top. Green and yellow versions are provided separately, allowing selection based on presentation theme or corporate brand colors.
Related Products
-

Service Development Plan Strengths & Weaknesses
#Business Management #Technical Approach #Diagram
-

Service Development Item Classification Diagram – Efficient Business Management
#Business Management #Technical Approach #Diagram
-

Business Idea Development Stage – Efficient Service Development Plans
#Business Management #Technical Approach #Diagram
-

Financial Services System Diagram - Innovative Service Development
#Business Management #Technical Approach #Diagram
