Event Alibi Diagram – Customer Analysis and Success Stories
RJ0800010_9
- Last Update 08/02/2025
- File Size 0.8MB
- # of Slides 2
- File Format PPTX
- Slide Ratio 16:9
- Color
Keywords
- #Content-Based Slides
- #Design-Based Slides
- #Market and Competitor Analysis
- #Customer Success Stories
- #Diagram
- #Customer Analysis
- #Customer Testimonials and Feedback
- #Cluster
- #Closed Cluster Diagram
- #16:9
- #closed circular diagram PowerPoint
- #4-step node slide template
- #customer analysis presentation
- #process flow diagram
- #business presentation slide design
About the Product
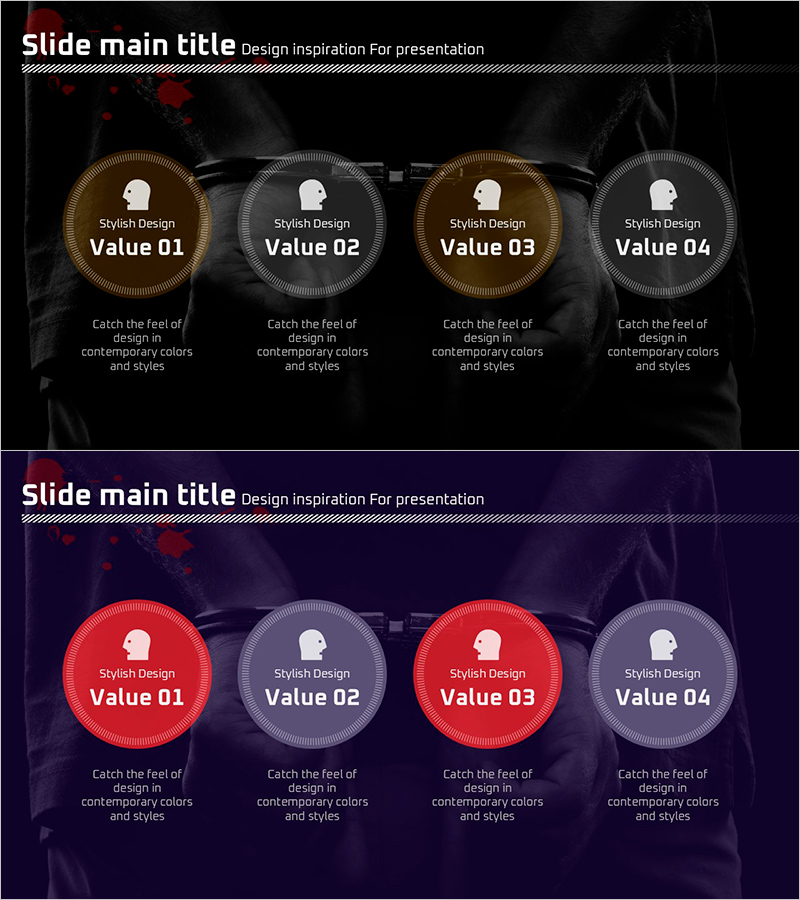
A 4-step closed circular diagram PowerPoint slide designed to visualize customer analysis and success stories. The design features a black background with gold and gray circular nodes arranged horizontally and connected by lines, creating a cohesive flow structure. Each node accommodates a title, icon, and descriptive text, making it ideal for presenting sequential relationships such as customer journeys, process stages, event alibis, or case studies. The 16:9 PPTX format allows for immediate editing and full customization of colors, text, and visual elements to match your presentation theme.
Usage Points
-
Main Usage
Effectively communicate 4-stage sequential relationships such as customer analysis, success stories, event timelines, or process workflows. The circular node structure emphasizes continuity and logical progression, helping audiences understand complex business concepts and decision-making processes.
-
How to Use
Enter stage titles and descriptions into each circular node. Customize colors to highlight priority stages or add icons for visual emphasis. Insert this slide into business reports, marketing proposals, strategy presentations, or case study decks to illustrate analytical frameworks and customer journey maps.
-
Recommended For
Marketing professionals, sales teams, business consultants, and project managers presenting customer journeys, sales funnels, project timelines, or analytical findings. Ideal for corporate reports, strategic presentations, training seminars, and client pitches where complex processes need clear visual representation.
-
Slide Structure
2-slide set. Slide 1 features two gold-toned circular nodes in a 4-step closed structure; Slide 2 features two gray-toned circular nodes in the same configuration. Each node includes a central icon area and lower text section, ensuring clear information hierarchy and visual balance across both layouts.
Related Products
-

Post-retirement Life Satisfaction Assessment Diagram – Customer Success Stories
#Market and Competitor Analysis #Marketing Plan and Strategy #Customer Success Stories
-

Customer Analysis Slide Visualizing Trial Results
#Market and Competitor Analysis #Customer Success Stories #Diagram
-

Visualizing Customer Feedback – Market Analysis and Success Stories
#Market and Competitor Analysis #Customer Success Stories #Diagram
-

Kids Horoscope Card – Customer Analysis and Success Stories
#Market and Competitor Analysis #Customer Success Stories #Diagram
