Expected Benefits of Collaborative Business Profits Diagram
RM0200010_11
- Last Update 02/03/2025
- File Size 1.7MB
- # of Slides 2
- File Format PPTX
- Slide Ratio 16:9
- Color
Keywords
- #Content-Based Slides
- #Design-Based Slides
- #Business Strategy
- #Diagram
- #Financial Outlook & Expected Impact
- #Cluster
- #Chain Diagram
- #16:9
- #central connection diagram PowerPoint
- #business benefits slide template
- #collaborative business diagram
- #expected benefits diagram
- #how to create connection diagram in PowerPoint
About the Product
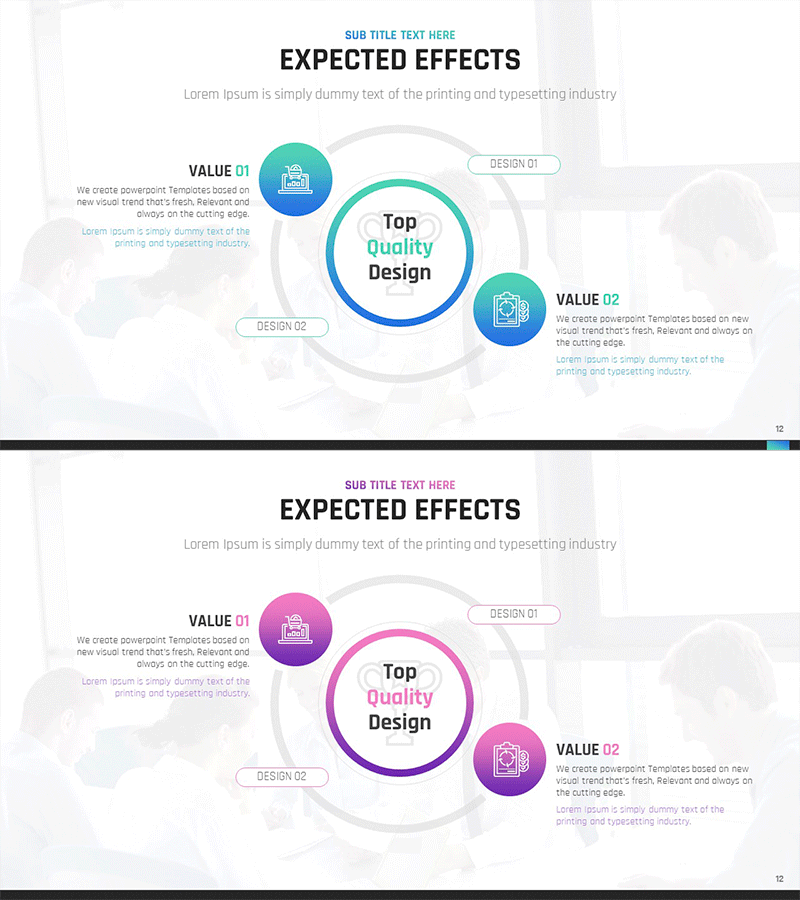
A central connection diagram PowerPoint slide that visualizes the expected benefits of collaborative business profits. The design features a central hub node with two satellite nodes on each side, clearly expressing business value and expected outcomes. Two color versions—teal and purple—are included, allowing you to select the version that matches your presentation theme and corporate branding. Each node contains an icon and text input area for immediate customization with specific items such as strategy, revenue, and benefits. The 16:9 widescreen format with 2 slides is ready to integrate into proposals, business plans, and strategic presentations.
Usage Points
-
Main Usage
This diagram is designed to communicate the core value and expected benefits of collaborative business at a glance. The radial structure from a central concept to side nodes clearly visualizes cause-and-effect relationships and interactions, emphasizing the logical flow of business models in strategy presentations, business proposals, and investment pitches.
-
How to Use
Enter the core concept (collaborative business, strategy, etc.) in the central circular node and populate the side nodes with specific value items (revenue generation, expected benefits, synergies, etc.). Adjust icon colors and text styling to match your corporate brand, and customize the number of nodes or text length as needed to align with your presentation content.
-
Recommended For
Ideal for executives, strategy managers, business development teams, consultants, and investment professionals presenting collaborative ventures, strategic partnerships, and revenue models. Effective in proposals, business plans, management reports, and investor pitch decks when explaining business value logically and visually.
-
Slide Structure
2-slide format with the first slide in teal color scheme and the second in purple. Each slide features 1 central circular node with 2 circular nodes on each side, connected by lines and icons representing relationships. All nodes include text input areas for flexible content editing and customization.
Related Products
-

Business Expected Effects Area Diagram – Profitability and Expectations
#Business Introduction #Business Strategy #Diagram
-

Mid-to-Long Term Vision & Growth Strategy Roadmap – Business Advancement Timeline
#Business Strategy #Diagram #Graph
-

Linked Diagram of Academic System
#Business Strategy #Operational Plan #Diagram
-

Big Data Development Plan by Year Slide
#Company Introduction #Business Management #Diagram
