Business Expected Effects Area Diagram – Profitability and Expectations
RM0200012_11
- Last Update 02/04/2025
- File Size 0.4MB
- # of Slides 2
- File Format PPTX
- Slide Ratio 16:9
- Color
Keywords
- #Content-Based Slides
- #Design-Based Slides
- #Business Introduction
- #Business Strategy
- #Diagram
- #Business Areas
- #Financial Outlook & Expected Impact
- #Cluster
- #Chain Diagram
- #16:9
- #connected diagram PowerPoint slide
- #5-node cluster diagram
- #business effects visualization
- #expected outcomes PPT template
- #circular node diagram slide
About the Product
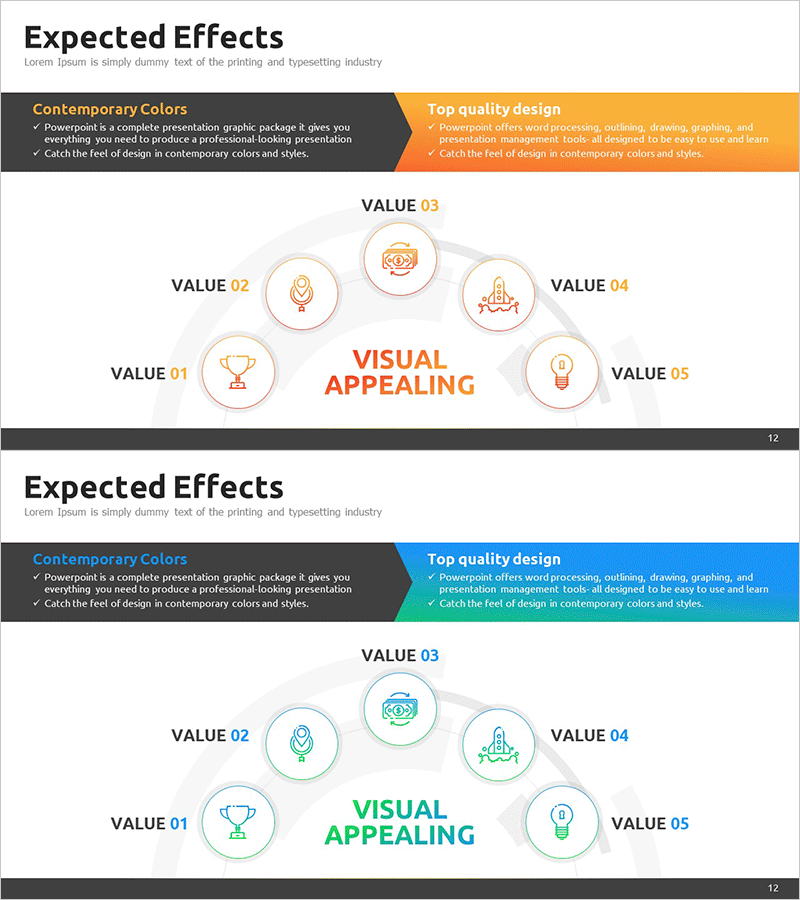
A connected diagram PowerPoint slide that visualizes business expected effects across five distinct areas. The design features a central 'Visual Appealing' core message surrounded by five value nodes (VALUE 01–05) arranged in a circular layout, each with an icon and text input field. Available in three color schemes—orange, gray, and blue—allowing customization to match corporate branding. The 2-slide set is ideal for business introductions, strategic initiatives, revenue projections, and expected outcomes presentations. Each node clearly separates different value propositions while maintaining visual hierarchy and balance.
Usage Points
-
Main Usage
Clearly communicate business expected effects by structuring them into a central core concept and five supporting value areas. The radial node layout emphasizes the central message while allowing detailed explanation of each benefit, creating a logical and persuasive visual narrative for stakeholder presentations.
-
How to Use
Insert this slide into the expected effects or value proposition section of business presentations, proposals, or investor pitches. Replace placeholder text in each node with specific benefits such as profitability, customer satisfaction, market expansion, technological innovation, or brand value. Add background context in the upper information box and select a color scheme matching your presentation theme.
-
Recommended For
Ideal for business strategists, marketing professionals, and executives preparing reports. Recommended for investment pitches, business plans, proposals, and company introductions where expected effects, vision, or value propositions need clear visualization. The five-node structure suits mid-sized organizations presenting strategic initiatives.
-
Slide Structure
Two-slide set. Each slide contains an upper information box (describing design approach and benefits) and a central five-node circular diagram. The five nodes are arranged radially around the center, each containing an icon, VALUE label, and editable text field. Three color variations—orange, gray, and blue—are provided for brand alignment.
Related Products
-

Core Service Structure Diagram – Exploring Business Areas
#Business Introduction #Technical Approach #Diagram
-

Core Business Area Diagram – Segmentation and Expansion
#Company Introduction #Business Introduction #Diagram
-

Business Area Overlap Diagram – Integration of Strategy and Vision
#Business Introduction #Business Vision and Strategy #Diagram
-

Expected Effect Diffusion Diagram – Visualizing Strategy and Vision
#Business Introduction #Business Strategy #Diagram
