Expected Profit Effect Diagram Slide for Financial Projections
RM0200009_11
- Last Update 02/03/2025
- File Size 3.1MB
- # of Slides 2
- File Format PPTX
- Slide Ratio 16:9
- Color
Keywords
- #Content-Based Slides
- #Design-Based Slides
- #Business Strategy
- #Market and Competitor Analysis
- #Diagram
- #Financial Outlook & Expected Impact
- #Market Analysis
- #Cluster
- #Closed Cluster Diagram
- #16:9
- #closed-center diagram PowerPoint
- #central diagram slide template
- #expected effects slide
- #4-node diagram
- #business strategy diagram PowerPoint slide
About the Product
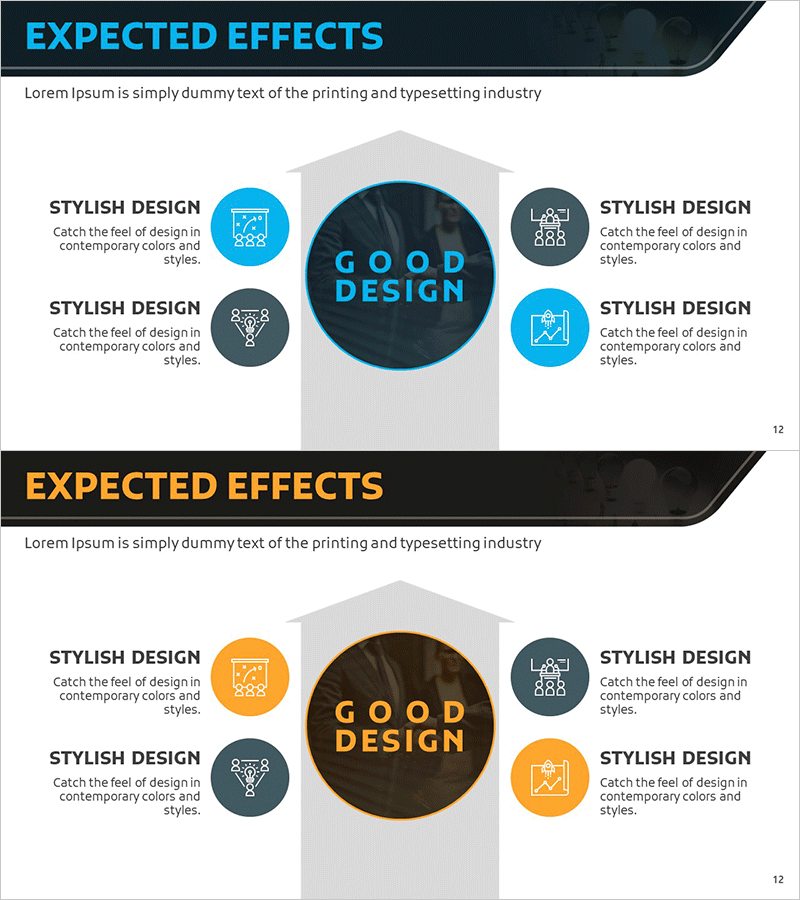
A closed-center diagram PowerPoint slide designed to visualize business strategy outcomes and revenue projections. The central core message is surrounded by four circular nodes with icons representing related benefits, using blue and gray tones for clear information hierarchy. Two color variations (blue and orange) allow you to match your presentation context, with each node providing editable text areas for immediate customization. Ideal for financial projections, competitive analysis, and market assessment sections where you need to communicate core benefits and expected outcomes simultaneously.
Usage Points
-
Main Usage
Communicate expected business outcomes and revenue projections by organizing four key benefits around a central core message. Icon-labeled nodes with editable text clearly convey specific effects, while color variations allow you to adjust presentation tone and visual consistency.
-
How to Use
Enter your core message in the central circular area (e.g., 'GOOD DESIGN'), then add expected effect items in each of the four surrounding nodes. Customize icons to match your content, and select either the blue or orange color version to align with your overall presentation design and branding.
-
Recommended For
Business plans, investment pitch decks, proposals, and marketing strategy presentations—particularly in financial projections, market entry benefits, and product adoption ROI sections. Effective for executive, investor, and client-facing presentations requiring clear benefit communication.
-
Slide Structure
One large central circular node (core message input area) surrounded by four smaller circular nodes (each with icon and text input field). Visual hierarchy achieved through dark background for center node and lighter colors for peripheral nodes. Two-slide set includes both blue and orange color variations for flexible design application.
Related Products
-

Expected Effects Based on Market Analysis – Insights Visualized by Data
#Business Strategy #Market and Competitor Analysis #Diagram
-

Using SWOT Analysis Hexagon Diagram – Optimizing Market Analysis
#Market and Competitor Analysis #Diagram #SWOT Analysis
-

SWOT Analysis List Slide – Innovative Visualization
#Market and Competitor Analysis #Diagram #SWOT Analysis
-

Split Bar Graph and Pill Shape Diagram – Highlighting Marketing Strategy
#Market and Competitor Analysis #Marketing Plan and Strategy #Diagram
