Cluster Diagram Slide for Service Operation Plan
RM0200008_22
- Last Update 02/03/2025
- File Size 2.1MB
- # of Slides 2
- File Format PPTX
- Slide Ratio 16:9
- Color
Keywords
- #Content-Based Slides
- #Design-Based Slides
- #Technical Approach
- #Diagram
- #Service Development Plan
- #Research and Development
- #Cluster
- #Chain Diagram
- #16:9
- #cluster diagram PowerPoint
- #service operation plan presentation
- #system development diagram slide
- #connected diagram PPT
- #technical planning PowerPoint template
About the Product
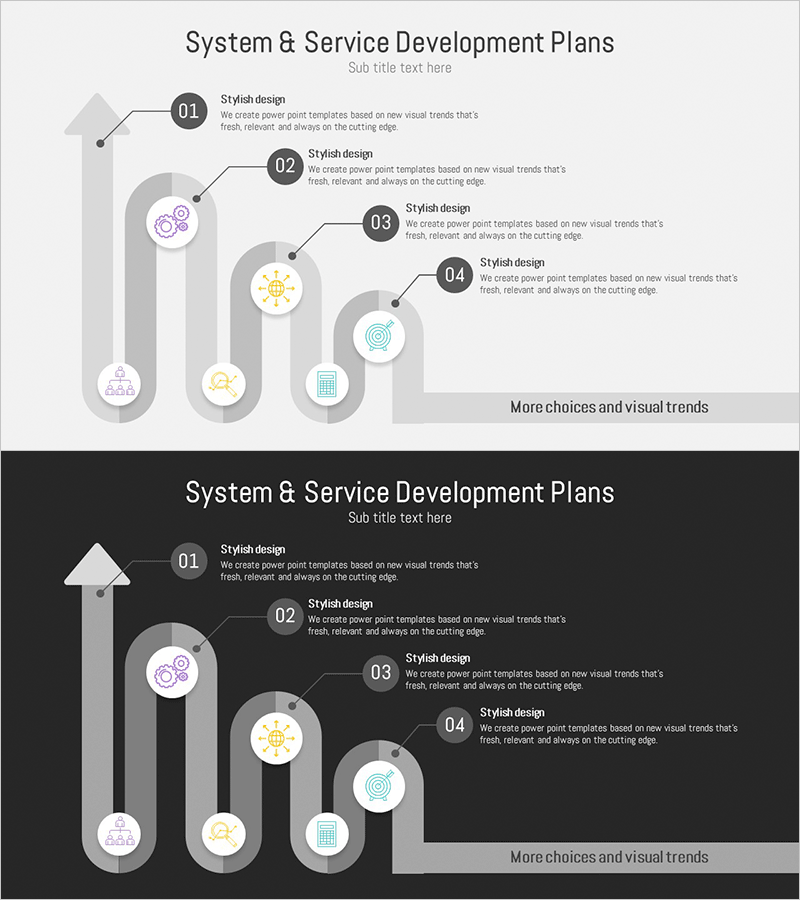
A cluster diagram PowerPoint slide that visualizes system and service development plans with a connected structure. The design features a central core element radiating to four related components, clearly expressing the interconnected relationships within service operation strategy. Set against a light gray background with purple, yellow, and blue icons, each stage is distinctly marked with numbered indicators and text descriptions that emphasize process flow. The 16:9 widescreen format with 2-slide composition is ready for immediate use in technical department presentations and system planning documents.
Usage Points
-
Main Usage
This diagram is designed to visually represent the interconnected relationships between core elements and related components in service operation and system development planning. The centralized structure organizes key strategies and detailed execution items hierarchically, enabling technical leaders and stakeholders to clearly understand the entire operational framework.
-
How to Use
Enter the core service name in the central circular icon and populate the four surrounding nodes with key operation plan items such as technical infrastructure, team composition, schedule management, and quality assurance. Double-click each node's text area to edit content, and customize the slide by adding nodes or changing colors to match your organization's specific needs.
-
Recommended For
Ideal for IT departments, development teams, system engineers, project managers, and technical directors presenting service operation strategies. Particularly effective for system architecture design meetings, technical planning reports, development roadmap presentations, and operational improvement initiatives where complex relationships need to be expressed simply and intuitively.
-
Slide Structure
Two-slide composition featuring a light gray background on the first slide with one central circular node connected by lines to four surrounding nodes. Each node displays icons in purple, yellow, blue, and cyan, with numbered indicators (01-04) and text description areas arranged on the right. The second slide provides a dark background version with identical structure for flexible presentation environment adaptation.
Related Products
-

Construction Management Chain System Slide – Structural Linkage and Integration
#Operational Plan #Technical Approach #Diagram
-

Diffusion Diagram of the Facility System
#Technical Approach #Diagram #Service Components
-

Abstract Pattern Diagram 1 – Visualizing Service Development Plans
#Technical Approach #Diagram #Service Development Plan
-

Step-by-Step Gear System Presentation Template – Innovation and Efficiency
#Technical Approach #Diagram #Service Development Plan
