Construction Management Chain System Slide – Structural Linkage and Integration
RJ0900031_10
- Last Update 08/25/2025
- File Size 0.2MB
- # of Slides 2
- File Format PPTX
- Slide Ratio 16:9
- Color
Keywords
- #Content-Based Slides
- #Design-Based Slides
- #Operational Plan
- #Technical Approach
- #Diagram
- #Production and Technology Development Strategy
- #Service Development Plan
- #Cluster
- #Chain Diagram
- #16:9
- #gear diagram PowerPoint
- #chain linkage slide template
- #3-node structure diagram
- #organizational connection PPT
- #process flow PowerPoint slide
About the Product
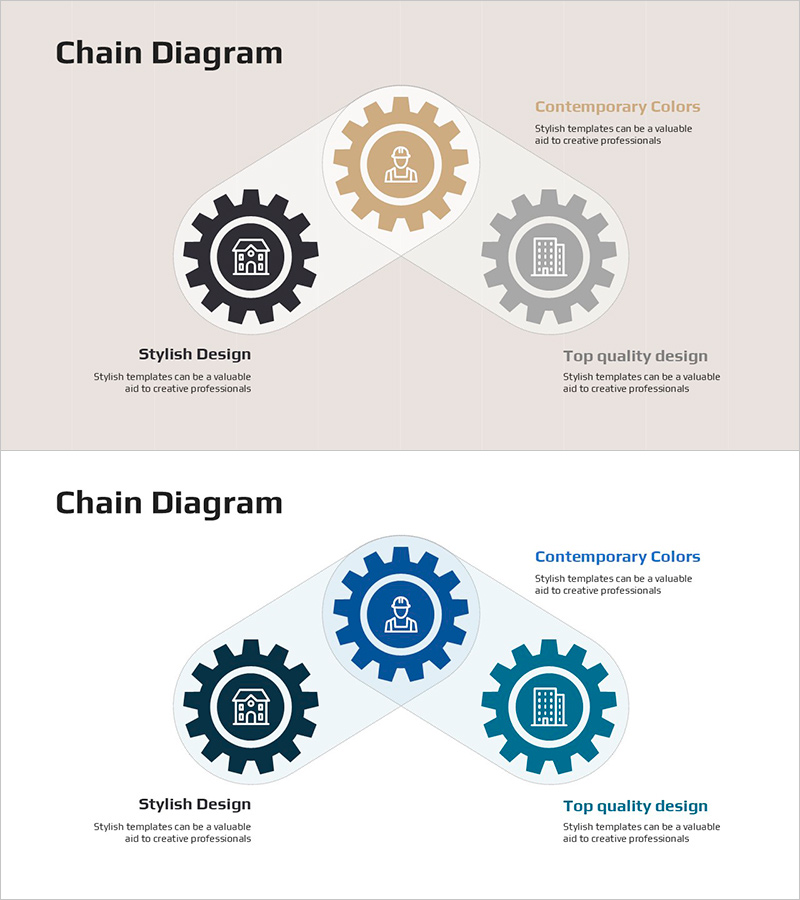
A 3-node chain diagram PowerPoint slide using gear icons to visualize organizational interconnection and system integration. The central top node (tan color) connects with left and right supporting nodes (black and gray) in a triangular arrangement, representing hierarchical relationships and process linkage. Set against a beige background with multi-tone colors (tan, black, gray), each node features occupational and building icons to clarify roles and responsibilities. The 2-slide set provides the same structure in blue tones (navy and teal) for flexible brand alignment. Ideal for construction, manufacturing, and organizational management presentations covering operational planning, technical specifications, and supplier network structures.
Usage Points
-
Main Usage
Represents organizational interaction, process linkage, and system integration relationships using a 3-node gear structure. Effectively communicates construction management hierarchies, manufacturing operations, supplier networks, and inter-departmental collaboration frameworks. The central primary node and flanking secondary nodes convey hierarchical relationships intuitively.
-
How to Use
Insert into business plans or operational planning documents in the organizational structure or collaboration system section. Use in technical proposals to explain system architecture. Edit node text with organization names, department titles, or functional roles. Adjust colors to match corporate branding. The 2-slide format allows repetition of the same content in different color schemes for emphasis.
-
Recommended For
Recommended for construction, manufacturing, and logistics executives, project managers, and technical leads explaining supplier linkage, supply chain structure, and inter-organizational responsibility distribution. Consulting firms and system integration (SI) companies can use this in proposals and reports to visualize process connection structures.
-
Slide Structure
2-slide set. Each slide displays 3 nodes (1 central, 2 flanking) represented as circular gear icons arranged in a triangular configuration. Slide 1 uses tan, black, and gray tones; Slide 2 provides the identical structure in navy and teal tones. Text input areas below each node accommodate organization names, roles, and descriptions.
Related Products
-

Market Share Donut Pie Chart - Harmony of Data and Feel
#Technical Approach #Diagram #Service Development Plan
-

Question Mark Connection Diagram – Facilitating Business Strategy
#Business Strategy #Operational Plan #Diagram
-

Service Development Item Classification Diagram – Efficient Business Management
#Business Management #Technical Approach #Diagram
-

Hologram Wide Diagram – Operations and Strategy
#Operational Plan #Marketing Plan and Strategy #Diagram
