Growth Expectation Effect Diagram – Visualizing Business Strategy
RM0200008_12
- Last Update 02/03/2025
- File Size 3.2MB
- # of Slides 2
- File Format PPTX
- Slide Ratio 16:9
- Color
Keywords
- #Content-Based Slides
- #Design-Based Slides
- #Business Strategy
- #Marketing Plan and Strategy
- #Diagram
- #Financial Outlook & Expected Impact
- #Marketing Objectives
- #Cluster
- #Closed Cluster Diagram
- #16:9
- #closed-form diagram PowerPoint
- #business strategy diagram slide
- #4-item icon slide template
- #expected effects visualization
- #marketing plan diagram PowerPoint
About the Product
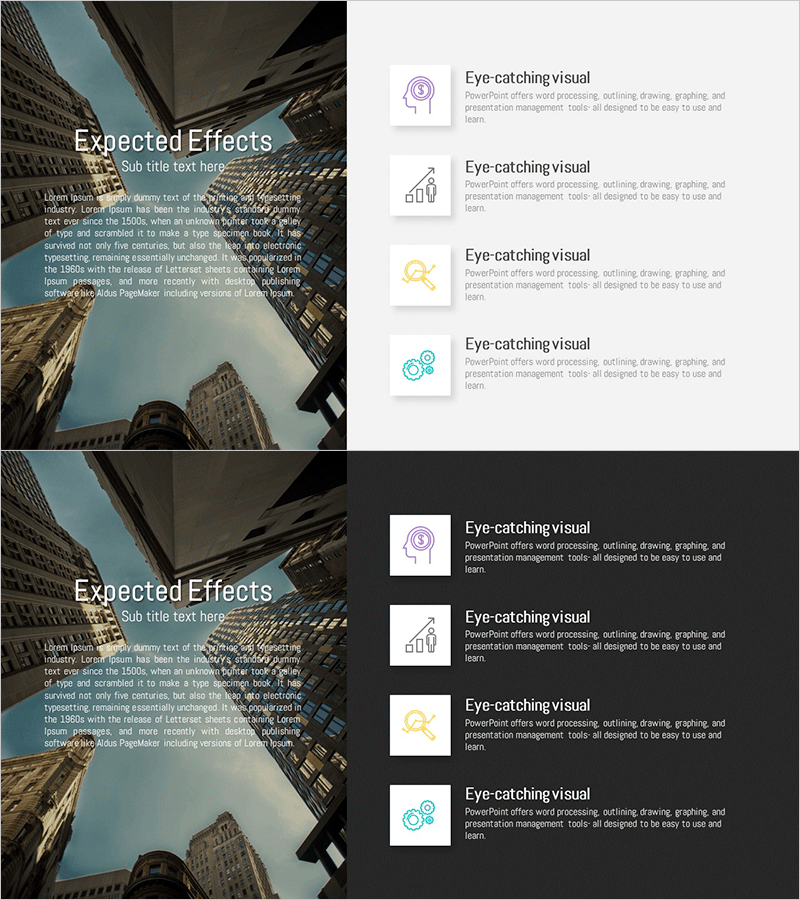
A 4-item closed-form diagram PowerPoint slide that visually expresses business strategy and expected effects. The design features a central core message with four symmetrically arranged icon areas and text fields, enabling balanced information delivery. Set against a light gray background, four distinct colored icons—purple, orange, yellow, and cyan—differentiate each item. This slide is ideal for business proposals, marketing plans, and strategic presentations where you need to emphasize expected outcomes. The 2-slide set offers flexible layout variations and is ready for immediate editing and use.
Usage Points
-
Main Usage
Visualizes business strategy and expected outcomes across four perspectives using a central radial structure. The design emphasizes equal importance of each item while maintaining overall strategic integration and cohesion.
-
How to Use
Apply to business plans, marketing proposals, and investor presentations in the expected effects or strategy results section. Input text into each icon area to represent four expected outcomes (revenue growth, cost reduction, customer satisfaction, market expansion) or strategic implementation results.
-
Recommended For
Marketing managers, business planners, and executives preparing strategic presentations and business documents. Suitable for new business initiatives, marketing campaign planning, organizational restructuring, and other business scenarios requiring clear communication of expected outcomes.
-
Slide Structure
2-slide set with central radial closed-form diagram layout. Each slide contains four equally-sized areas positioned at top, bottom, left, and right. Each area includes a colored icon (purple, orange, yellow, cyan) with text input box, and a central core message area for the main strategic focus.
Related Products
-

Product Differentiation Closed Diagram
#Product/Service Introduction #Marketing Plan and Strategy #Diagram
-

Cluster Diagram Visualizing Bank Securities Services Marketing Objectives
#Business Vision and Strategy #Marketing Plan and Strategy #Diagram
-

Mobile App Service Goals – Effective Business Strategy
#Business Vision and Strategy #Marketing Plan and Strategy #Diagram
-

Introducing the Business Program Slide - Based on Marketing Strategy
#Product/Service Introduction #Marketing Plan and Strategy #Diagram
