Target-specific Analysis Diagram – Customer Insights and Value Delivery
RM0200007_15
- Last Update 02/02/2025
- File Size 1.9MB
- # of Slides 2
- File Format PPTX
- Slide Ratio 16:9
- Color
Keywords
- #Content-Based Slides
- #Design-Based Slides
- #Product/Service Introduction
- #Market and Competitor Analysis
- #Diagram
- #Graph
- #Development Status
- #Customer Analysis
- #Cluster
- #Chain Diagram
- #16:9
- #overlapping Venn diagram PowerPoint
- #customer analysis slide template
- #dual-circle diagram PPT
- #target audience comparison slide
- #value delivery PowerPoint template
- #customer segmentation presentation
About the Product
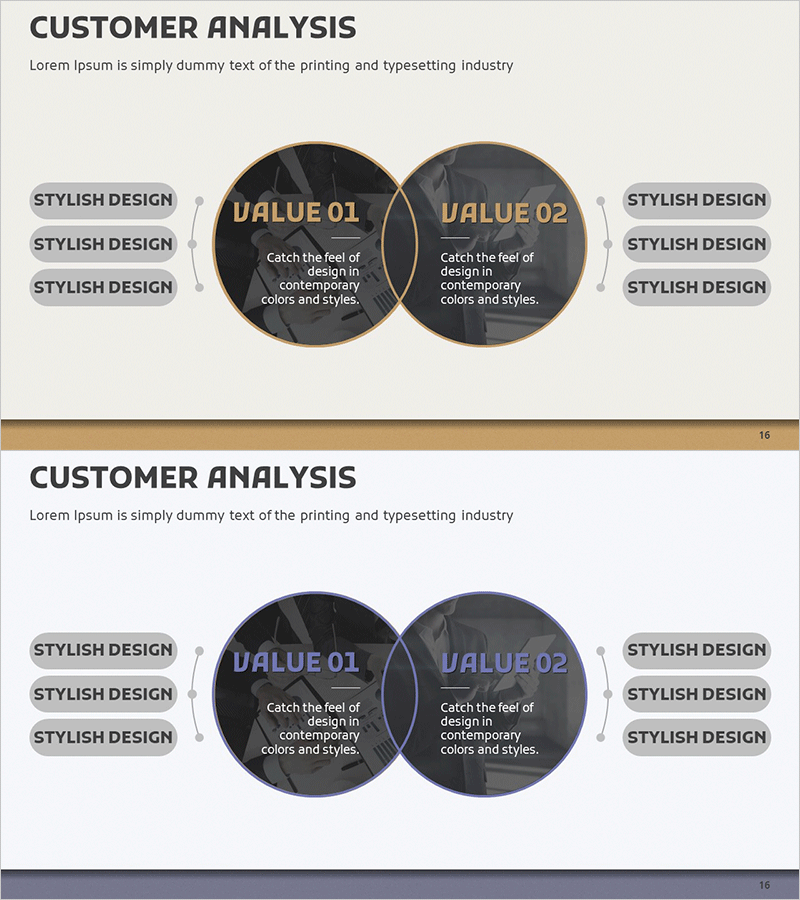
A professional PowerPoint slide featuring two overlapping circular nodes to visualize customer analysis and value delivery. The design uses a dark gray background with gold borders and white typography, creating a sophisticated presentation aesthetic. Six text boxes—three on each side—allow you to organize target-specific analysis items, while the overlapping center area emphasizes shared value between segments. This 16:9 widescreen slide deck contains 2 fully editable slides in PPTX format. Ideal for market analysis, competitive positioning, customer segmentation, and strategic planning presentations.
Usage Points
-
Main Usage
This slide enables simultaneous comparison of customer segment characteristics and shared value propositions. The overlapping circles create a visual intersection area that clearly distinguishes commonalities and differences between target groups, while the flanking text boxes allow detailed articulation of each segment's unique attributes.
-
How to Use
Enter the first customer segment's characteristics in the three left text boxes and the second segment's traits in the three right boxes. Use the overlapping center area to highlight shared values or intersection points, enhancing the analytical depth. All text, colors, and formatting are fully customizable to match your brand guidelines.
-
Recommended For
Marketing professionals, business development teams, consultants, and market analysts will find this template valuable for customer segmentation strategies, competitive benchmarking, and target market definition. Perfect for investor pitch decks, business plans, and marketing strategy presentations.
-
Slide Structure
2-slide deck with centered overlapping circular nodes (approximately 200px diameter each) on a dark gray background. Three gray text boxes are vertically aligned on the left side and three on the right. Gold-bordered circles contain white text. Optimized for 16:9 widescreen display format.
Related Products
-

Chemical Experiment Research Analysis Diagram – Innovation and Progress
#Company Introduction #Product/Service Introduction #Diagram
-

Target Setting Diagram – Market and Competitor Analysis
#Market and Competitor Analysis #Marketing Plan and Strategy #Diagram
-

Visualizing Company Service Development Status with Diagrams
#Company Introduction #Product/Service Introduction #Diagram
-

System Development Status Graph – Visualizing Market Share
#Product/Service Introduction #Market and Competitor Analysis #Diagram
