Market Trend Analysis Graph - Market and Competitive Analysis
RM0200006_13
- Last Update 02/02/2025
- File Size 1.3MB
- # of Slides 2
- File Format PPTX
- Slide Ratio 16:9
- Color
Keywords
- #Content-Based Slides
- #Design-Based Slides
- #Market and Competitor Analysis
- #Graph
- #Market Analysis
- #Industry Trends
- #Column
- #Grouped Column
- #16:9
- #grouped bar chart PowerPoint
- #market analysis slide template
- #competitive analysis graph
- #data comparison chart PPT
- #how to create grouped bar chart in PowerPoint
About the Product
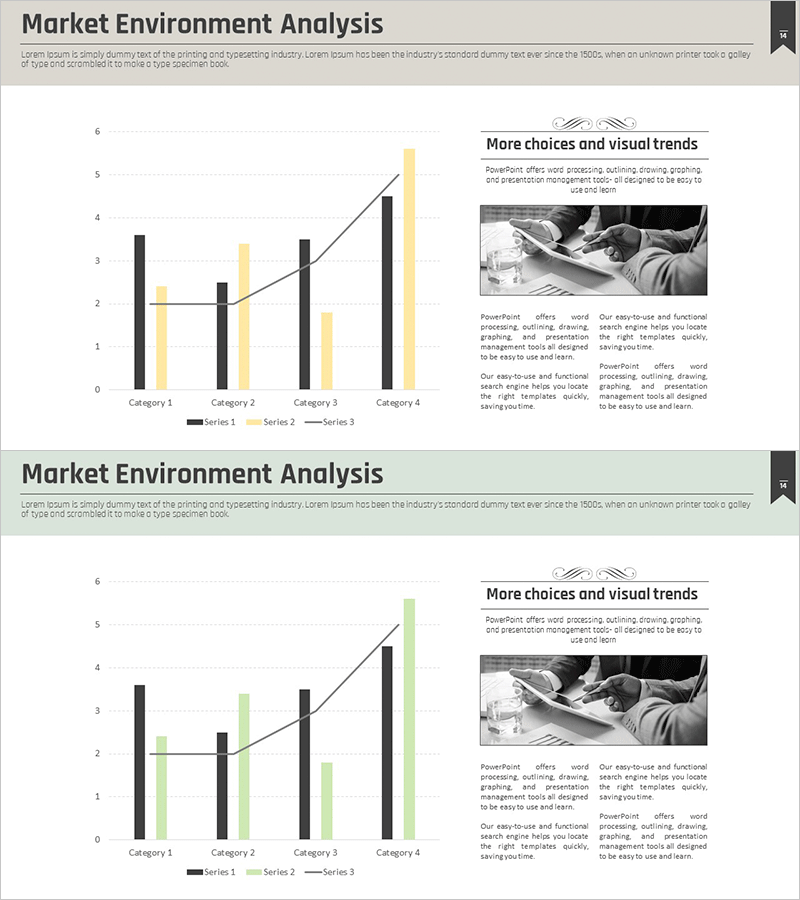
A grouped bar chart PowerPoint slide designed for market environment analysis and competitive benchmarking. This presentation template displays data across 4 categories with 3 series side-by-side, enabling clear numerical comparison and trend visualization. The dual-tone color scheme (black and yellow bars combined with trend lines) effectively communicates market shifts and performance metrics. Ready to use in business reports, market analysis presentations, marketing strategy decks, and executive briefings.
Usage Points
-
Main Usage
The primary objective is to visualize market environment data and competitive comparisons with clarity and impact. By arranging 4 categories with 3 series in grouped bars and adding trend lines, the slide helps audiences instantly grasp market dynamics and performance trajectories.
-
How to Use
Simply input your actual data into the slide template for immediate deployment. Update category labels and series values, and the chart automatically recalculates. Apply to quarterly performance reports, market research presentations, competitive analysis briefings, and strategic planning sessions.
-
Recommended For
Ideal for marketing teams, strategy departments, sales teams, and executives presenting market analysis and competitive positioning. Particularly effective for quarterly performance comparisons, market share analysis, competitive benchmarking, and trend forecasting presentations.
-
Slide Structure
Two-slide set featuring grouped bar charts with identical structure but different color schemes. First slide uses black and yellow bars with trend line; second slide uses black and green bars. Both include 4 categories, 3 data series, and overlay trend lines to emphasize directional change.
Related Products
-

Food Market Growth Analysis - Insights Through Data Visualization
#Market and Competitor Analysis #Graph #Market Analysis
-

Senior Lifestyle Market Analysis PowerPoint Template
#Market and Competitor Analysis #Diagram #Graph
-

Clustered Column Slide Template for Market Trends and Analysis
#Market and Competitor Analysis #Graph #Market Analysis
-

Marketing Performance Analysis Chart by Year – Visualizing Market Trends
#Market and Competitor Analysis #Diagram #Graph
