Clustered Column Slide Template for Market Trends and Analysis
RJ0400003_15
- Last Update 05/17/2025
- File Size 3.9MB
- # of Slides 2
- File Format PPTX
- Slide Ratio 16:9
- Color
Keywords
- #Content-Based Slides
- #Design-Based Slides
- #Market and Competitor Analysis
- #Graph
- #Market Analysis
- #Industry Trends
- #Column
- #Grouped Column
- #16:9
- #clustered column chart PowerPoint
- #grouped bar chart slide template
- #year-over-year comparison slide
- #market analysis graph PowerPoint
- #data visualization slide download
About the Product
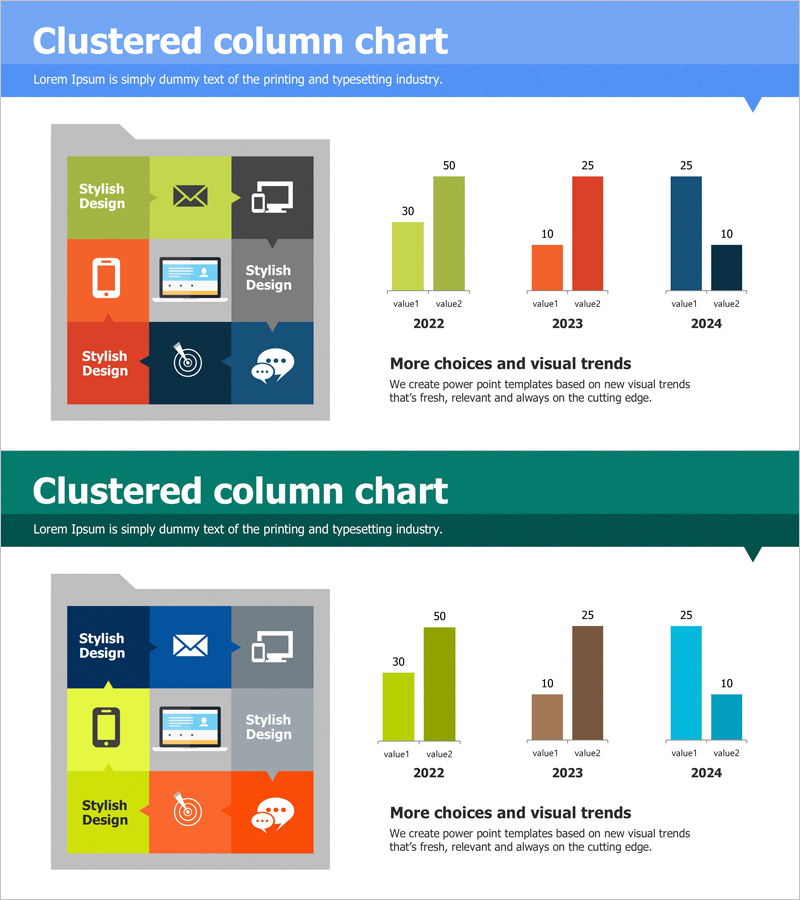
A clustered column chart PowerPoint slide designed for market trends and business analysis. This template visualizes 3-year data comparison across 2 data series (2022, 2023, 2024), ideal for presenting sales performance, customer acquisition, or market share trends. The left side features an icon grid with business symbols (email, mobile, web, analytics), while the right displays the grouped bar chart. This 2-slide set is ready to use in executive reports, investor presentations, and strategic business decks for immediate impact.
Usage Points
-
Main Usage
Compare multi-year or multi-category data across 2+ series to reveal market trends, performance growth, and competitive positioning. Effectively communicates quantitative insights in executive summaries, investor pitches, and strategic business presentations.
-
How to Use
Replace chart values, year labels, and series names with your actual data. Customize the icon grid on the left to match your business context. Adjust bar colors to align with corporate branding, and modify chart dimensions as needed for your presentation layout.
-
Recommended For
Finance, marketing, sales, and strategy professionals presenting quarterly revenue, customer metrics, or market share analysis. Ideal for business plans, annual reports, investor relations decks, and consulting proposals requiring data-driven storytelling.
-
Slide Structure
Slide 1: Header with title and description, left icon grid (4 business symbols), right clustered column chart (3 years × 2 data series with value labels). Slide 2: Color variant with alternate header and chart palette. 16:9 aspect ratio, PPTX format, 2-slide set.
Related Products
-

Marketing Performance Analysis Chart by Year – Visualizing Market Trends
#Market and Competitor Analysis #Diagram #Graph
-

Senior Lifestyle Market Analysis PowerPoint Template
#Market and Competitor Analysis #Diagram #Graph
-

Food Market Growth Analysis - Insights Through Data Visualization
#Market and Competitor Analysis #Graph #Market Analysis
-

Market Trend Analysis Graph - Market and Competitive Analysis
#Market and Competitor Analysis #Graph #Market Analysis
