Food Market Growth Analysis - Insights Through Data Visualization
RJ0800046_26
- Last Update 08/13/2025
- File Size 0.1MB
- # of Slides 2
- File Format PPTX
- Slide Ratio 16:9
- Color
Keywords
About the Product
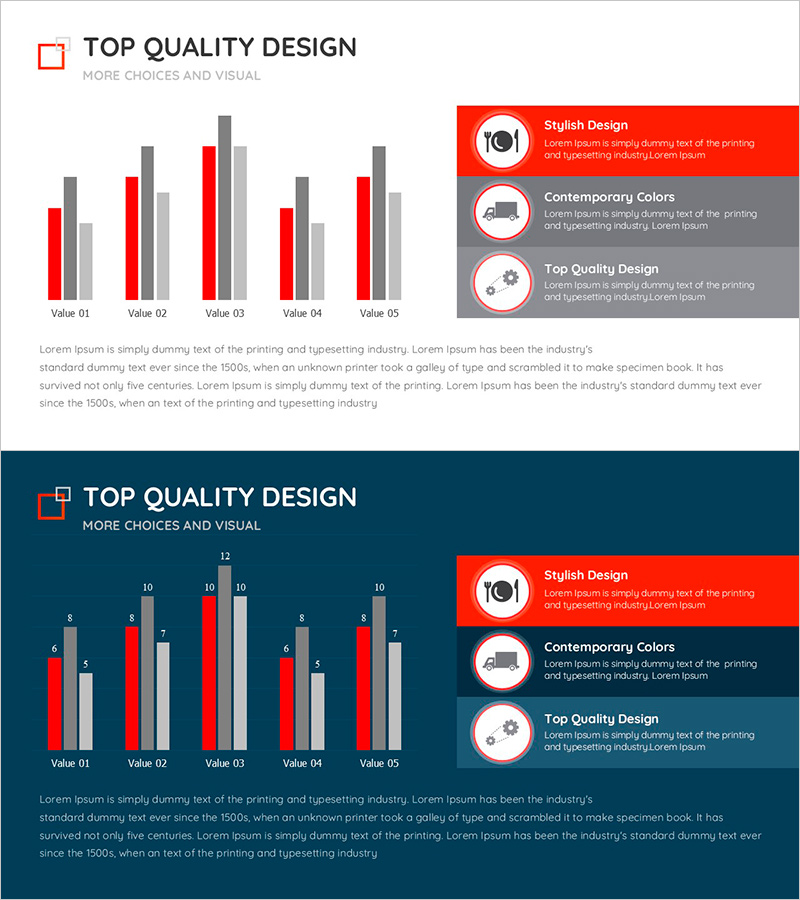
A 2-slide PowerPoint presentation featuring clustered bar charts for food market growth rate analysis and data visualization. The set includes both light and dark background designs, each displaying five data items in red and gray color schemes. Combines horizontal and vertical bar formats to optimize comparative analysis and trend representation. Delivered in 16:9 widescreen PPTX format with fully editable elements, suitable for market analysis reports, business presentations, sales pitches, and executive briefings across various industries.
Usage Points
-
Main Usage
Visualizes quantitative data such as market size, growth rates, and competitive comparisons in the food industry with clarity and precision. Clustered bar charts arrange multiple data series side-by-side for intuitive comparative analysis. Essential for executive reports, investor presentations, and strategic market entry planning where data credibility and visual impact are critical.
-
How to Use
Slide 1 features a light background with five horizontal bars for side-by-side comparison, while Slide 2 uses a dark background with vertical bars optimized for trend analysis. Customize bar colors (red/gray) to distinguish categories, years, or product lines. Edit numerical labels directly to match your actual data and adjust axis scales as needed.
-
Recommended For
Food and beverage industry marketing teams, market research analysts, business planning managers, sales executives, and investor relations professionals. Ideal for quarterly and annual growth reports, competitive benchmarking, new product launch strategies, shareholder meetings, and investor pitch decks.
-
Slide Structure
2-slide set. Slide 1: Light background (white/light gray) + 5-item horizontal clustered bar chart (red and gray series) + legend and value labels. Slide 2: Dark background (navy/black) + 5-item vertical clustered bar chart (red and gray series) + legend and value labels. 16:9 widescreen, fully editable PPTX.
Related Products
-

Clustered Column Slide Template for Market Trends and Analysis
#Market and Competitor Analysis #Graph #Market Analysis
-

Marketing Performance Analysis Chart by Year – Visualizing Market Trends
#Market and Competitor Analysis #Diagram #Graph
-

Senior Lifestyle Market Analysis PowerPoint Template
#Market and Competitor Analysis #Diagram #Graph
-

Market Trend Analysis Graph - Market and Competitive Analysis
#Market and Competitor Analysis #Graph #Market Analysis
