Subdivided Graph for Analysis Results – Market Analysis and Customer Feedback
RM0200005_17
- Last Update 02/02/2025
- File Size 3.5MB
- # of Slides 2
- File Format PPTX
- Slide Ratio 16:9
- Color
Keywords
- #Content-Based Slides
- #Design-Based Slides
- #Market and Competitor Analysis
- #Customer Success Stories
- #Graph
- #Market Analysis
- #Customer Testimonials and Feedback
- #Horizontal Bar
- #Segmented Horizontal Bar
- #16:9
- #subdivided bar graph PowerPoint
- #stacked bar chart presentation
- #data analysis slide template
- #market analysis chart
- #customer feedback visualization
- #analysis results PowerPoint slide
About the Product
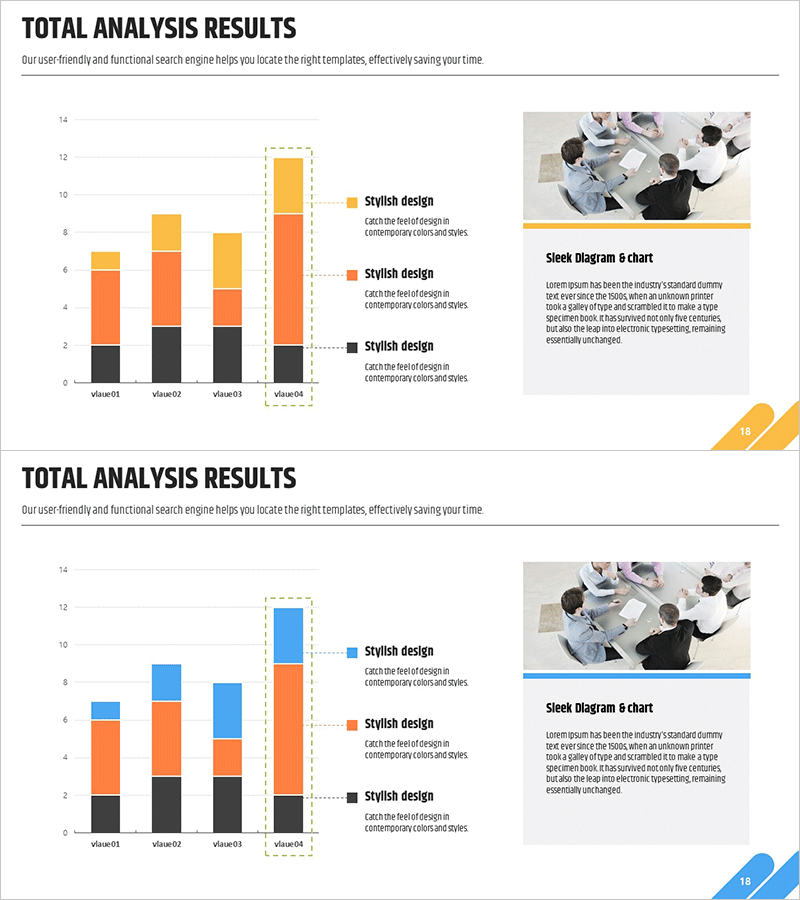
A subdivided bar graph PowerPoint slide that clearly communicates market analysis and customer feedback data. The stacked bar chart uses three color layers—black, orange, and yellow—to intuitively represent complex datasets and is optimized for comparative analysis across items. Perfect for presentations and reports that require quantitative results visualization, with 2 slides enabling multiple analysis scenarios. Provided in fully editable PPTX format for easy data modification and color adjustment.
Usage Points
-
Main Usage
Specialized for decomposing and expressing quantitative analysis results by layer. Ideal for comparing market research data, customer satisfaction surveys, and sales performance analysis where three or more categories require simultaneous display of both composition ratios and absolute values.
-
How to Use
Place in the analysis results section of presentation materials or on data analysis pages of management reports. Modify bar heights and color segments to input actual data, then adjust legend and axis labels to match your situation. Use 2 slides to express temporal changes or regional comparisons.
-
Recommended For
Recommended for marketing professionals, data analysts, management report coordinators, consultants, and academic presenters. Suitable for all presentation scenarios requiring complex data comparison such as market analysis, customer surveys, sales analysis, and operational performance evaluation.
-
Slide Structure
Consists of 2 slides, each containing a stacked bar graph with 4 items. Data is segmented and expressed using three color layers—black, orange, and yellow—with legend and description text areas positioned on the right. Optimized for 16:9 widescreen format compatible with modern projectors and online presentations.
Related Products
-

Body Organ Analysis Subdivision Graph - Market and Competitor Comparison
#Market and Competitor Analysis #Graph #Competitor Analysis
-

Business Sector Analysis Chart – Multifaceted Visualization
#Business Introduction #Market and Competitor Analysis #Diagram
-

Living Room Interior and Horizontal Cumulative Charts – Assessing Market Trends
#Market and Competitor Analysis #Graph #Market Analysis
-

Target Country Analysis Chart – Data Visualization for Market Analysis
#Market and Competitor Analysis #Graph #Other
