System Overlap Diagram – Effective Visualization of Service Development Strategies
RJ0600011_22
- Last Update 06/23/2025
- File Size 1MB
- # of Slides 2
- File Format PPTX
- Slide Ratio 16:9
- Color
Keywords
- #Content-Based Slides
- #Design-Based Slides
- #Technical Approach
- #Diagram
- #Service Development Plan
- #Research and Development
- #Cluster
- #Combination Diagram
- #16:9
- #overlap diagram PowerPoint
- #Venn diagram slide template
- #intersection diagram presentation
- #service strategy visualization
- #cluster diagram template download
About the Product
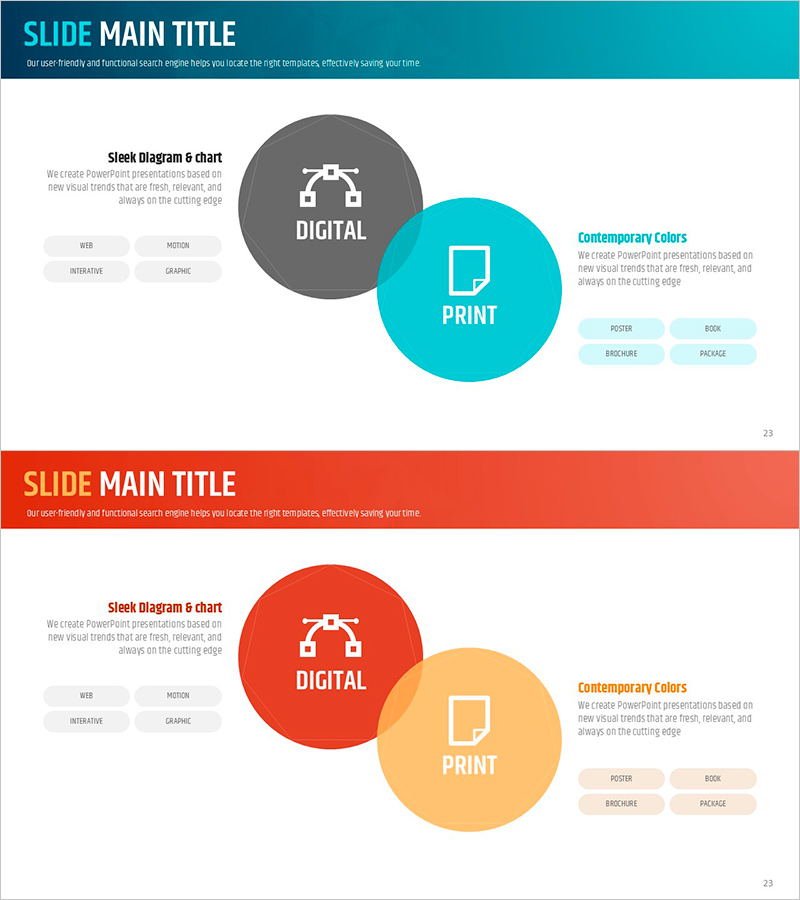
A two-circle overlap diagram PowerPoint slide that visualizes the intersection between digital and print services. Gray and turquoise circular shapes overlap to effectively express commonalities and differences between two domains. Icons and text labels are positioned in each area to clearly communicate service development strategies, technology analysis, and research findings. The 2-slide set offers multiple color combinations (turquoise-gray, orange-yellow) that can be selected to match your presentation tone.
Usage Points
-
Main Usage
This diagram effectively expresses relationships and intersections between two or more services, technologies, or concepts. It is ideal for illustrating integrated strategies between digital marketing and offline channels, overlapping areas in technology stacks, and common characteristics across customer segments.
-
How to Use
Modify the text and icons within each circular shape to match your presentation topic. Enter the first concept (e.g., Digital) in the left circle, the second concept (e.g., Print) in the right circle, and shared elements in the overlapping center area. Choose from the two existing color combinations or customize colors freely.
-
Recommended For
Suitable for service development strategy presentations, technology analysis reports, market research findings, business proposals, and marketing plans where explaining relationships between two domains is needed. Ideal for executive meetings, planning team discussions, marketing team presentations, and client pitches.
-
Slide Structure
Two-slide set, each containing a two-circle overlap diagram with two circular nodes and one central intersection area. First slide features gray-turquoise combination; second slide offers orange-yellow combination. Each area includes four icons (web, motion, interactive, graphic) and text labels for customization.
Related Products
-

Cluster Diagram Slide for Service Development Plan
#Technical Approach #Diagram #Service Development Plan
-

Financial Services Development Plan – Effective Diagram Utilization
#Technical Approach #Diagram #Service Development Plan
-

Cluster Diagram Slide for Service Operation Plan
#Technical Approach #Diagram #Service Development Plan
-

Market Share Donut Pie Chart - Harmony of Data and Feel
#Technical Approach #Diagram #Service Development Plan
