Visualizing Business Sales Growth Characteristics – A Diagram for Effective Understanding
RM0200004_10
- Last Update 02/01/2025
- File Size 0.3MB
- # of Slides 2
- File Format PPTX
- Slide Ratio 16:9
- Color
Keywords
- #Content-Based Slides
- #Design-Based Slides
- #Product/Service Introduction
- #Diagram
- #Features
- #Benefits and Advantages
- #Cluster
- #Chain Diagram
- #16:9
- #radial diagram PowerPoint
- #business characteristics slide
- #6-item analysis template
- #central concept visualization
- #how to create radial diagram in PowerPoint
About the Product
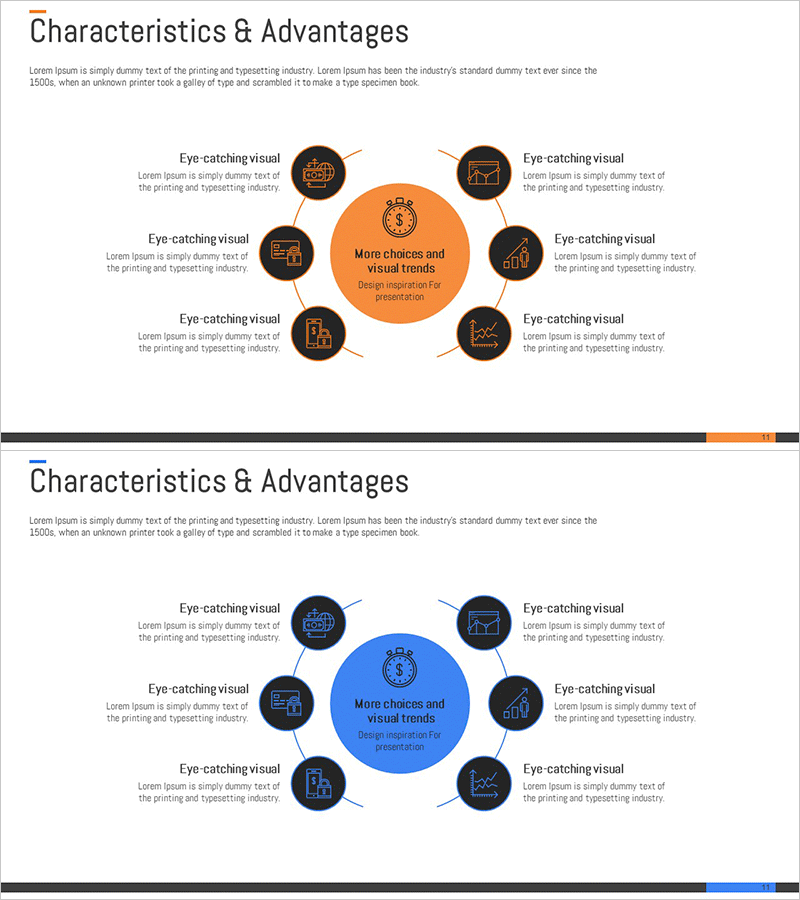
A radial diagram PowerPoint slide with six satellite nodes extending from a central concept hub. Ideal for visualizing business characteristics, sales growth drivers, competitive advantages, and strategic factors. Two color versions—orange and blue—are included, each with icons and descriptive text areas for every item. This design naturally guides audience attention from the central core to surrounding elements, making complex information intuitive and memorable. Fully editable PPTX format ready for immediate customization.
Usage Points
-
Main Usage
Visualizes information that radiates from a central concept—business characteristics, growth drivers, competitive advantages, or core values. The radial structure emphasizes equal importance of each item while anchoring focus on the central theme.
-
How to Use
Enter your central topic in the hub circle, then add specific items to each of the six satellite nodes. Customize icons to match your business context and update descriptive text. Select the color version that aligns with your presentation tone.
-
Recommended For
Business plans (business model sections), proposals (solution characteristics), marketing strategies (strategic elements), company profiles (core values), executive reports, investor pitches, and strategic planning meetings.
-
Slide Structure
One central hub (orange or blue circle) with six dark satellite nodes arranged radially around it. Each node includes an icon and adjacent text area. Connection lines link satellites to the center. Two slides provided with color variations.
Related Products
-

Feature Diffusion Diagram – Characteristics and Advantages
#Product/Service Introduction #Diagram #Features
-

Real Estate Highlights Circular Diagram – Advanced Cluster Display
#Product/Service Introduction #Diagram #Features
-

Crock Diagram for Visualizing Product Features and Benefits – Cluster and Connection
#Product/Service Introduction #Diagram #Features
-

Waterproof Interior Material Introduction – Diagram Highlighting Benefits and Features
#Product/Service Introduction #Diagram #Features
