Project Expected Effects Diagram – Effective Marketing Strategy
RM0200003_11
- Last Update 02/01/2025
- File Size 2.8MB
- # of Slides 2
- File Format PPTX
- Slide Ratio 16:9
- Color
Keywords
- #Content-Based Slides
- #Design-Based Slides
- #Business Strategy
- #Marketing Plan and Strategy
- #Diagram
- #Financial Outlook & Expected Impact
- #Marketing Strategy
- #Flow
- #Circular Flow
- #16:9
- #circular diagram PowerPoint
- #3-step cycle slide template
- #expected effects diagram
- #marketing strategy presentation
- #process flow PowerPoint slide
About the Product
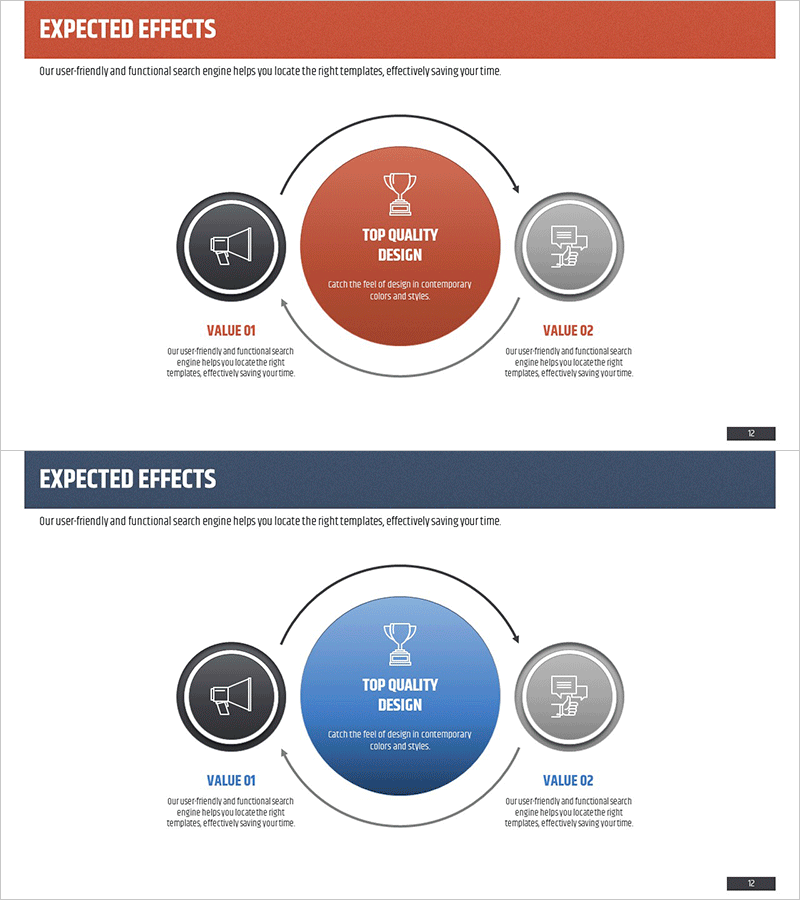
A PowerPoint slide that visualizes project expected effects using a 3-node circular diagram structure. The central core message is connected to VALUE 01 (left) and VALUE 02 (right) through directional arrows, creating a cycle that represents marketing strategy, business impact, and anticipated outcomes. Available in two color versions—terracotta red and navy blue—with customizable icon and text fields for each node. Ideal for business proposals, strategic reports, and effect presentations. 16:9 widescreen format with 2-slide set for easy editing and immediate deployment.
Usage Points
-
Main Usage
Clearly communicate project or marketing strategy expected effects through a 3-node circular structure. The central core value (TOP QUALITY DESIGN) is surrounded by left and right effects in a cyclical arrangement, intuitively conveying cause-and-effect relationships and mutual interactions. Effectively explains business impact, marketing outcomes, and anticipated results in a step-by-step manner.
-
How to Use
Place this slide in the 'Expected Effects' or 'Anticipated Outcomes' section of proposals, business plans, or marketing strategy documents. Input core messaging in the central circular node and detailed effects in the left and right nodes, with arrows indicating the cyclical relationship. Select the color version (terracotta red or navy blue) that matches your document's tone for visual consistency.
-
Recommended For
Marketing teams, strategy teams, and sales professionals creating proposals and strategy documents. Project managers and consultants explaining project impact, and executives preparing performance reports. Particularly effective when emphasizing interconnected effects or cyclical value creation.
-
Slide Structure
2-slide set with terracotta red background on slide 1 and navy blue background on slide 2. Each slide features a large central circular node (TOP QUALITY DESIGN text + trophy icon), a left node with speaker icon (VALUE 01), and a right node with monitor icon (VALUE 02). All three nodes are connected by directional arrows in a circular flow. Each node includes a text area below for customized input.
Related Products
-

Service Differentiation Strategy Diagram – Effective Marketing Strategy
#Product/Service Introduction #Marketing Plan and Strategy #Diagram
-

Sleek Infographic Diagram for Value Presentation – Visually Appealing Slide
#Product/Service Introduction #Marketing Plan and Strategy #Diagram
-

Business Direction Strategy Structure Diagram – Visual Planning for Business Efficiency
#Business Vision and Strategy #Marketing Plan and Strategy #Diagram
-

Business Strategy Structure Diagram – Setting Effective Marketing Strategy Goals
#Business Vision and Strategy #Marketing Plan and Strategy #Diagram
