Navy Brown Profit Calculation Table
RM0100019_32
- Last Update 01/31/2025
- File Size 0.9MB
- # of Slides 2
- File Format PPTX
- Slide Ratio 16:9
- Color
Keywords
About the Product
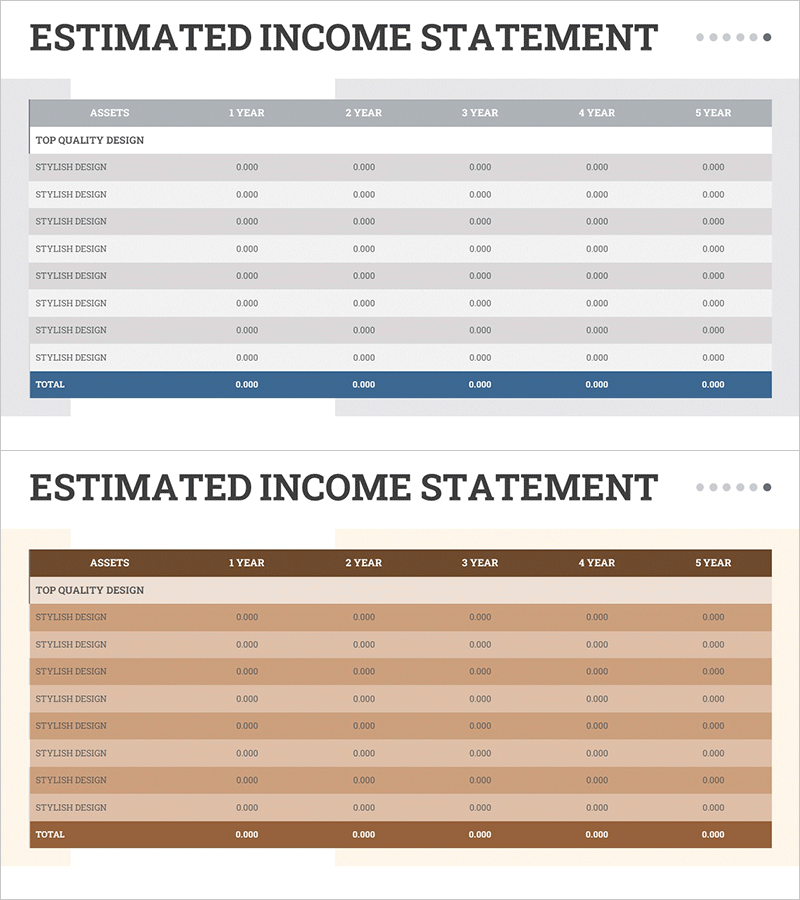
A financial data PowerPoint slide designed to present estimated revenue across five years in a structured table format. The navy header and brown row divisions enhance readability of financial figures, with dedicated input areas for assets and year-by-year figures. Ideal for investor presentations, business plans, and financial reports to communicate projected income and revenue analysis effectively. Ready-to-use editable slide for immediate deployment in presentations.
Usage Points
-
Main Usage
Visualize projected revenue and asset status across five years in investor pitches, business plans, and financial reports using data-driven figures to establish financial credibility with stakeholders and investors.
-
How to Use
Enter item names in the 'Assets' row and corresponding year values in the 1-Year through 5-Year columns. The navy header and brown row divisions create clear data hierarchy, making large financial datasets easy to comprehend at a glance.
-
Recommended For
CFOs, finance managers, and business development teams presenting to investors, reporting to executives, or developing financial forecasts. Highly applicable in startup investor relations, corporate business plans, and financial analysis report sections.
-
Slide Structure
Header row (Assets + 5 year columns) + 9 data input rows + total row. Each row is distinguished by brown tones for clear information hierarchy, with sufficient input space to accommodate complex financial data in an organized, professional format.
Related Products
-

Retirement Budget Planning Table – The First Step to Financial Stability
#Financial Plans and Performance #Diagram #Capital Requirements
-

Current Camping Business Technology Status Table
#Financial Plans and Performance #Diagram #Capital Requirements
-

Blue Pink Sales and Profit Table
#Financial Plans and Performance #Diagram #Capital Requirements
-

Fund Planning and Revenue Tables – Financial Performance Analysis
#Financial Plans and Performance #Diagram #Other
