Annual Sales and Profit Table – Clearly Presenting Financial Plans
RM0100013_32
- Last Update 01/29/2025
- File Size 0.3MB
- # of Slides 2
- File Format PPTX
- Slide Ratio 16:9
- Color
Keywords
About the Product
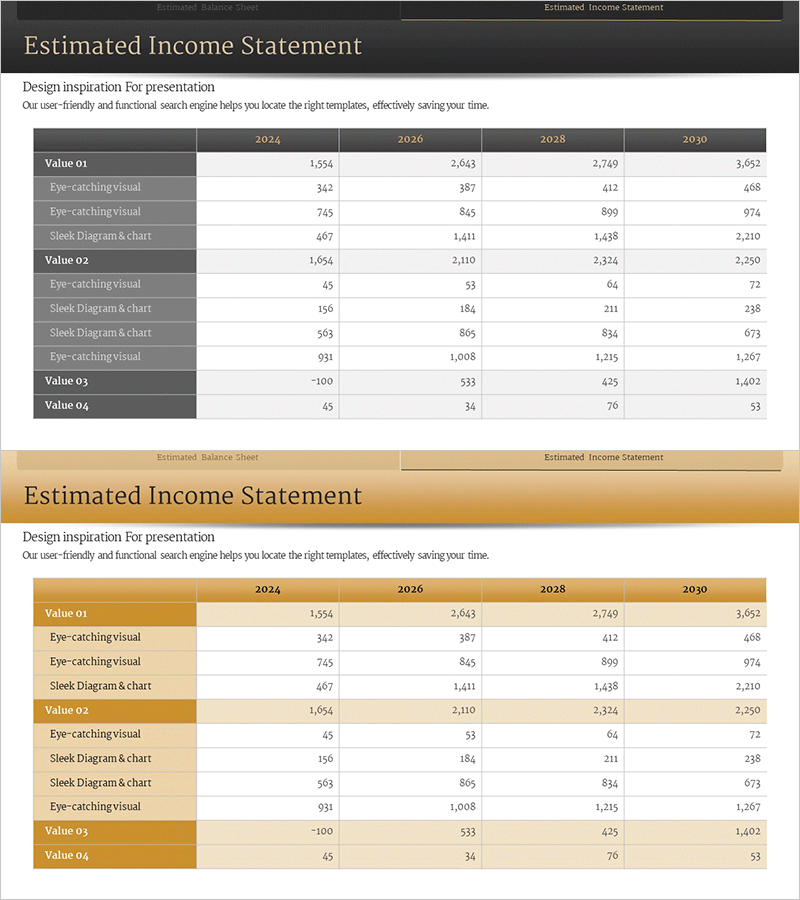
A financial performance PowerPoint slide that clearly presents annual sales and profit data across multiple years. This slide deck features a structured table format comparing revenue and profit figures from 2024 through 2030, with dark gray headers and white background for optimal data readability. The row-based information hierarchy ensures clear visual separation of financial metrics. Designed for investor presentations, shareholder reports, and executive meetings, this 2-slide set enables immediate use in financial communications and business planning documents.
Usage Points
-
Main Usage
This financial table slide enables data-driven comparison of annual revenue and net profit across multiple years. It communicates financial health and growth trajectory to investors, shareholders, and executives with credibility and clarity, serving as a critical component in business plans, investor relations materials, and executive reports.
-
How to Use
Simply input your actual sales and profit figures into the table cells for immediate presentation use. To emphasize year-over-year trends, highlight specific rows or add supplementary text boxes for comparative analysis. The dark gray color scheme reinforces corporate credibility, so customize it to match your company's brand colors for cohesive visual communication.
-
Recommended For
Finance professionals, CFOs, investor relations managers, and executives presenting at shareholder meetings, investor briefings, and board meetings. Ideal for financial sections in business plans, historical performance analysis in investor presentations, and profitability analysis in executive reports.
-
Slide Structure
Two-slide set with consistent table structure: dark gray header row (Value 01–04 labels) and four year columns (2024, 2026, 2028, 2030). The second slide features an alternative design with gold-tone headers. Each slide provides 8–10 data entry rows for flexible financial metric input.
Related Products
-

Estimated Income Report Analysis Table – Financial Planning and Performance
#Financial Plans and Performance #Diagram #Capital Requirements
-

Visualizing Financial Planning and Performance with Table Charts
#Financial Plans and Performance #Diagram #Capital Requirements
-

Retirement Budget Planning Table – The First Step to Financial Stability
#Financial Plans and Performance #Diagram #Capital Requirements
-

Clothing Business Sales and Profit Statement – Essential Tool for Business Performance
#Financial Plans and Performance #Diagram #Capital Requirements
