Visualizing Financial Planning and Performance with Table Charts
RJ0500003_16
- Last Update 06/08/2025
- File Size 4.7MB
- # of Slides 2
- File Format PPTX
- Slide Ratio 16:9
- Color
Keywords
About the Product
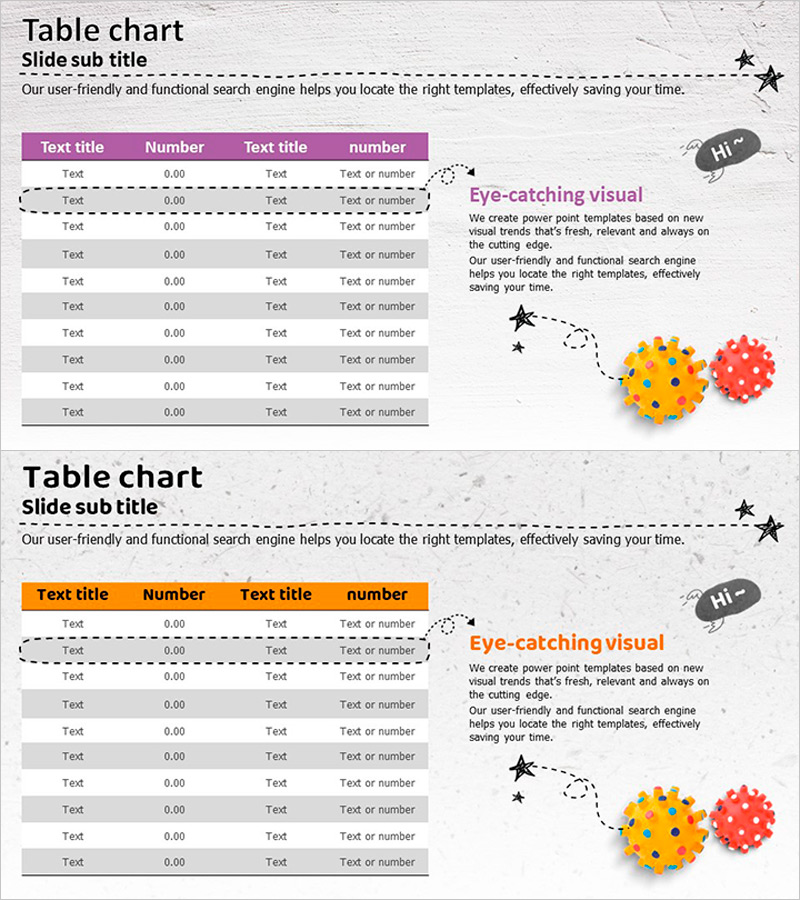
This slide utilizes toys and table charts to effectively visualize financial planning and performance. With a harmonious design of purple and orange, the layout clearly presents data and text, making it ideal for conveying information in business meetings or presentations. This slide is well-suited for discussing funding needs and sales revenue while leaving a distinct and appealing impression on users. Additionally, it is easy to replace the text and numbers in the table, rated 'easy' in terms of editing difficulty, allowing for seamless integration without requiring special design skills.
Usage Points
-
Main Usage
- This template is designed for visualizing financial data in business reports, enabling clear communication of key metrics during strategy meetings. It enhances the understanding of funding requirements and sales performance with engaging visuals that captivate the audience's attention.
-
How to Use
- Users can incorporate this template into their presentations by simply inputting their specific data and insights. This feature facilitates quick adaptations for various scenarios, such as budget proposals or performance reviews, without needing advanced design expertise.
-
Recommended For
- Ideal for financial analysts and business managers who need to present complex data in a digestible format. It is particularly beneficial for those preparing for stakeholder meetings or internal reviews where clarity and impact are crucial.
-
Slide Structure
- The layout consists of a combination of charts and tables arranged to guide the viewer through the financial narrative. Each section builds upon the previous one, allowing for a logical progression of ideas, making it easier to follow during presentations or discussions.
Related Products
-

Infinite Energy Wide PPT Table Analysis – Core of Financial Planning
#Financial Plans and Performance #Diagram #Capital Requirements
-

Current Camping Business Technology Status Table
#Financial Plans and Performance #Diagram #Capital Requirements
-

Invoice of Required Funds for Financial Planning – A Slide for Efficient Fund Management
#Financial Plans and Performance #Diagram #Capital Requirements
-

Annual Sales and Profit Table – Clearly Presenting Financial Plans
#Financial Plans and Performance #Diagram #Capital Requirements
