Car Sharing Service History – Visualized with Connected Diagram
RM0100018_5
- Last Update 01/31/2025
- File Size 1.7MB
- # of Slides 2
- File Format PPTX
- Slide Ratio 16:9
- Color
Keywords
About the Product
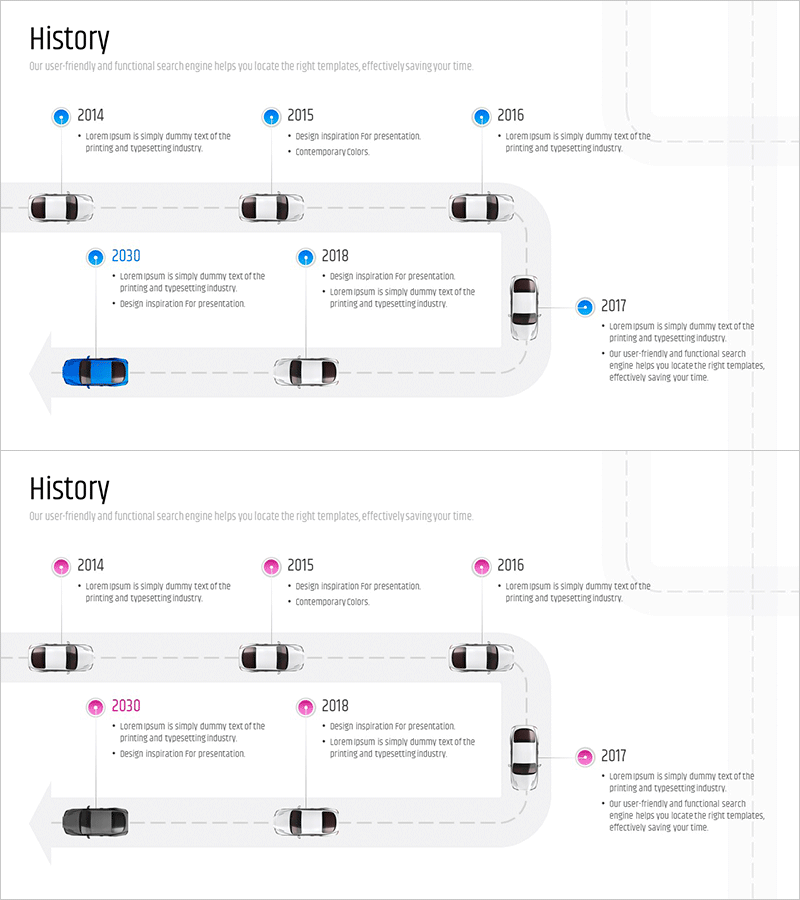
A connected diagram PowerPoint slide visualizing the evolution of car sharing services across five key milestones from 2014 to 2030. Each year is represented as a blue circular node linked by dotted lines, showing the progression and growth stages of the service. Black car icons and descriptive text accompany each node to clarify the timeline and key developments. The 16:9 widescreen format with 2-slide layout integrates seamlessly into company presentations, business reports, and investor pitches.
Usage Points
-
Main Usage
Designed to illustrate corporate development timelines, service evolution phases, and project milestones in chronological order. The node-to-node connection structure emphasizes causality and continuity between stages, enabling audiences to grasp the company's growth trajectory intuitively.
-
How to Use
Apply this slide in company history sections of corporate presentations, performance summaries in business reports, and growth story segments of investor meetings. Edit node text to reflect your organization's or project's milestones, and customize colors and icons to match your brand identity.
-
Recommended For
Startup founders, corporate marketing teams, business development managers, consultants, and educational institution representatives presenting organizational growth. Particularly effective for mobility services, sharing economy, and car-sharing industry presentations.
-
Slide Structure
Five blue circular nodes (2014, 2015, 2016, 2017, 2018, 2030) connected by dotted lines, with black car icons and descriptive text positioned beside each node. Nodes alternate vertically to create visual rhythm, with the overall flow progressing toward the lower right.
Related Products
-

Fountain Pen History Diagram – Emphasizing Corporate Identity
#Company Introduction #Product/Service Introduction #Diagram
-

History Flag Shape Diagram - Company Growth and Vision
#Company Introduction #Diagram #History
-

History Road Diagram – A Cluster Diagram Ideal for Company Introduction
#Company Introduction #Diagram #History
-

Company History Mini Diagram – Clear and Concise Timeline
#Company Introduction #Diagram #History
