Competitor Comparison Analysis Diagram – Leading Market Insights
RM0100017_12
- Last Update 01/30/2025
- File Size 0.2MB
- # of Slides 2
- File Format PPTX
- Slide Ratio 16:9
- Color
Keywords
About the Product
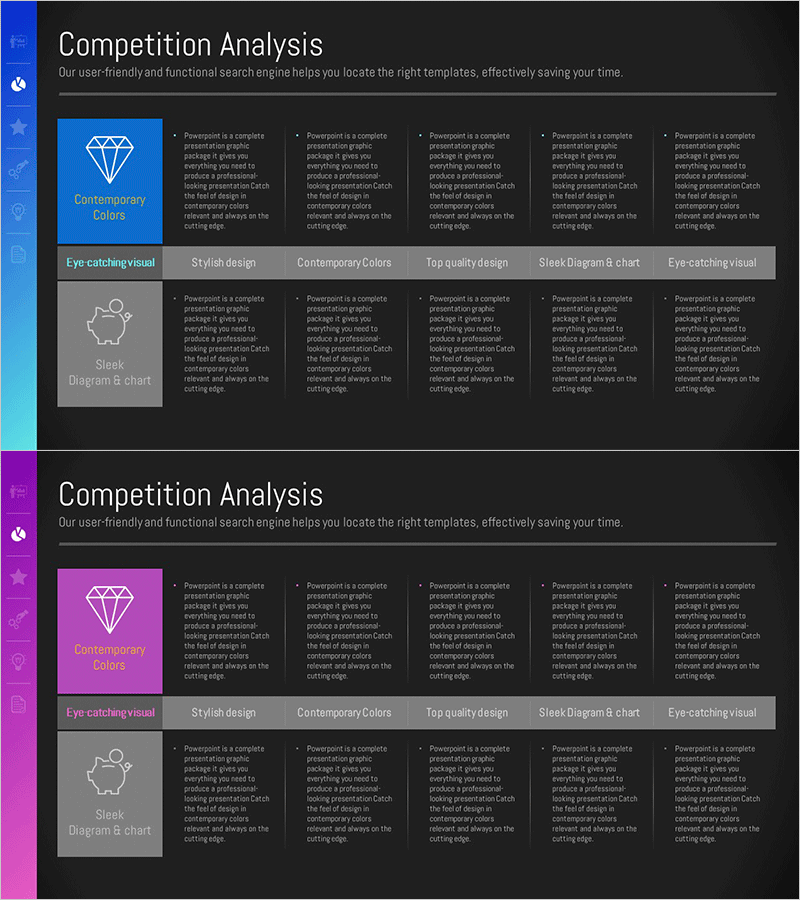
An essential PowerPoint slide for market analysis and competitive strategy development. This competitor comparison analysis presentation features a dual-tone blue and purple background with diamond icons and piggy bank diagrams to visually compare competitor strengths and weaknesses. The 2-slide set includes a Contemporary Colors theme slide with a diamond symbol displaying 5 competitor details, and a Sleek Diagram format slide using piggy bank icons to emphasize cost efficiency. Immediately applicable for business plans, pitch decks, and investor presentations in the competitive landscape analysis section.
Usage Points
-
Main Usage
Provides a clear visual comparison of competitor strengths, weaknesses, and differentiation factors during market analysis. Effectively communicates competitive landscape and your company's market positioning to investors, executives, and team members.
-
How to Use
Place in the competitive analysis section of business plans, pitch decks, or strategy presentations. Use the first slide to list 5 key competitors with their characteristics, and the second slide for cost efficiency or market share comparisons. Simply input actual competitor names and analysis data into the text fields.
-
Recommended For
Strategy planning teams, marketing departments, and executives presenting competitive environment analysis. Particularly valuable for new market entry, product launch, and investor pitch presentations where competitive positioning is critical.
-
Slide Structure
2-slide format. First slide features diamond icon-centered layout with 5 input areas for competitor information. Second slide uses piggy bank diagram with 4 comparison areas for cost and efficiency metrics. Each slide includes descriptive text areas on the right side for detailed analysis.
Related Products
-

Competitor and Market Analysis Green Navy Slide
#Market and Competitor Analysis #Graph #Competitor Analysis
-

Competitor and Market Analysis Slide – Pink & Bluegreen PowerPoint Template
#Market and Competitor Analysis #Graph #Competitor Analysis
-

Vertical Bar Cluster Analysis Graph – Market and Competitor Analysis
#Market and Competitor Analysis #Graph #Competitor Analysis
-

Comparative Analysis of Vertical Bar Bundles
#Market and Competitor Analysis #Graph #Competitor Analysis
