Baby and Toddler Products Business Market Graph
RM0100016_10
- Last Update 01/30/2025
- File Size 0.4MB
- # of Slides 2
- File Format PPTX
- Slide Ratio 16:9
- Color
Keywords
- #Content-Based Slides
- #Design-Based Slides
- #Market and Competitor Analysis
- #Graph
- #Competitor Analysis
- #Market Analysis
- #Line
- #Line Chart
- #16:9
- #line chart PowerPoint slide
- #market analysis presentation template
- #dual-series trend chart
- #market trend visualization
- #competitive analysis graph PowerPoint
About the Product
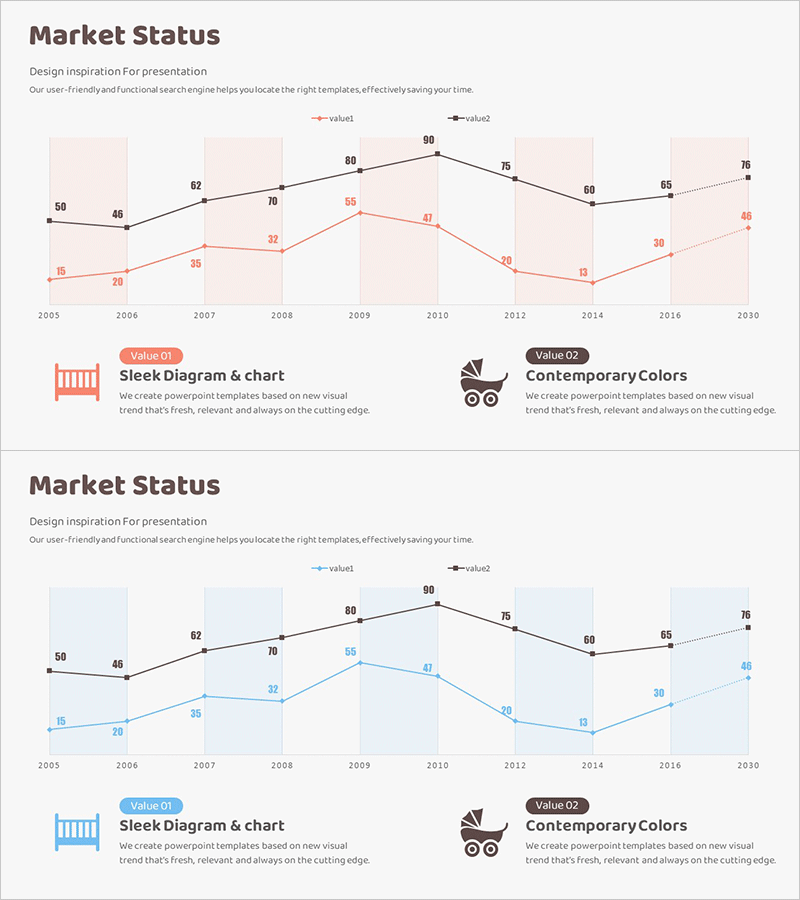
A dual-series line chart PowerPoint slide designed for baby and toddler products market analysis. This slide template visualizes two data series over time, enabling side-by-side comparison of market trends and competitive performance. Two design versions are included—one with a beige background and one with a blue background—each featuring the same chart structure. Data points and numerical labels are clearly marked for immediate presentation use, and all colors and values are fully editable to match your specific market data.
Usage Points
-
Main Usage
This slide is designed to compare market trends and competitive performance across time periods. The dual-series format allows you to display two data sets simultaneously, making it ideal for showing growth trajectories, market fluctuations, and comparative analysis. Perfect for business reports, investment pitches, and marketing strategy presentations.
-
How to Use
Open the slide and replace the existing data points and numerical labels with your market data. You can maintain the series colors (black and pink) or customize them to match your brand palette. Adjust the time axis labels (years, months, or quarters) as needed. Choose between the beige or blue background version depending on your presentation's overall design tone.
-
Recommended For
Business analysts, marketing managers, and investment professionals in the consumer goods, retail, and baby products sectors. Use this template to present quarterly or annual performance comparisons, product line revenue trends, market share evolution, and competitive benchmarking. Ideal for stakeholder presentations and strategic planning documents.
-
Slide Structure
Two-slide set with identical line chart structure. The X-axis displays years from 2005 to 2030, while the Y-axis shows a numerical scale from 0 to 100. Two data series are represented by different-colored lines with clearly labeled data points. A legend area at the bottom identifies Value 01 and Value 02, with space for descriptive text explaining each series.
Related Products
-

Market Analysis Graph & Notebook Mockup – Understanding the Market through Data Visualization
#Market and Competitor Analysis #Graph #Other
-

Black Navy Broken Line Graph Table – Market and Competitor Analysis
#Market and Competitor Analysis #Diagram #Graph
-

Competitor Capability Analysis Chart – Efficient Market Analysis
#Market and Competitor Analysis #Graph #Competitor Analysis
-

Data Visualization Using Line Chart – Modern Design
#Market and Competitor Analysis #Graph #Competitor Analysis
