Clothing Business Sales and Profit Statement – Essential Tool for Business Performance
RM0100015_32
- Last Update 01/29/2025
- File Size 3.5MB
- # of Slides 2
- File Format PPTX
- Slide Ratio 16:9
- Color
Keywords
- #Content-Based Slides
- #Design-Based Slides
- #Financial Plans and Performance
- #Diagram
- #Capital Requirements
- #Sales and Revenue
- #Table
- #16:9
- #income statement PPT slide
- #financial data table PowerPoint
- #sales and profit slide
- #clothing business financial PPT
- #how to create a financial table in PowerPoint
About the Product
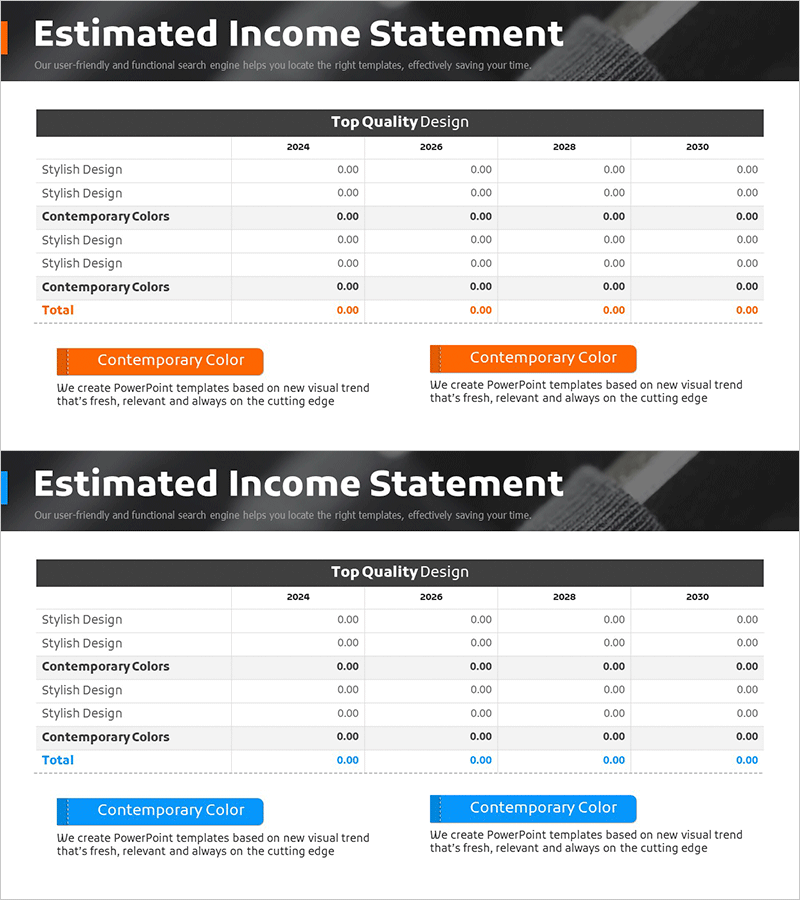
A 2-slide financial presentation set that clearly displays clothing business sales and profit figures in tabular format. Features an orange and gray dual-tone background with year-over-year data (2024, 2026, 2028, 2030) organized in a 4-column table structure, accompanied by stylish design and color options. These PowerPoint slides are ready to use in executive reports, investor presentations, and financial planning sessions. The layout provides clear text input areas and is optimized for numerical data visualization, enabling professional communication of company financial performance.
Usage Points
-
Main Usage
Visualizes clothing business revenue and profit figures on a numerical basis to communicate business performance objectively. Organizing financial data in table format enables investors, employees, and partners to grasp business profitability at a glance.
-
How to Use
Use in executive reports, quarterly or annual financial presentations, investor relations materials, and business plan presentations as the financial section. Replace table figures with actual data and select color options (orange, gray, or blue) to customize the design to match your corporate brand.
-
Recommended For
CFOs, finance managers, executives, investor relations specialists, and business planning teams explaining financial status. Applicable to clothing, fashion, and retail industries, as well as any sector requiring sales and profit comparison analysis.
-
Slide Structure
Organized in 2 slides, each containing a table layout with 4 years of data (2024, 2026, 2028, 2030). The two-dimensional comparison structure of row items (stylish design, color options) and column data (year-by-year figures) maximizes financial readability and data clarity.
Related Products
-

Invoice of Required Funds for Financial Planning – A Slide for Efficient Fund Management
#Financial Plans and Performance #Diagram #Capital Requirements
-

Infinite Energy Wide PPT Table Analysis – Core of Financial Planning
#Financial Plans and Performance #Diagram #Capital Requirements
-

Visualizing Financial Planning and Performance with Table Charts
#Financial Plans and Performance #Diagram #Capital Requirements
-

Funding Plan Analysis Table – Clear Visualization of Financial Performance
#Financial Plans and Performance #Diagram #Capital Requirements
