Funding Plan Analysis Table – Clear Visualization of Financial Performance
RM0100007_32
- Last Update 01/26/2025
- File Size 0.4MB
- # of Slides 2
- File Format PPTX
- Slide Ratio 16:9
- Color
Keywords
- #Content-Based Slides
- #Design-Based Slides
- #Financial Plans and Performance
- #Diagram
- #Capital Requirements
- #Sales and Revenue
- #Table
- #16:9
- #income statement PowerPoint slide
- #financial data table template
- #3-year comparison table
- #how to create financial statements in PowerPoint
- #revenue analysis slide
About the Product
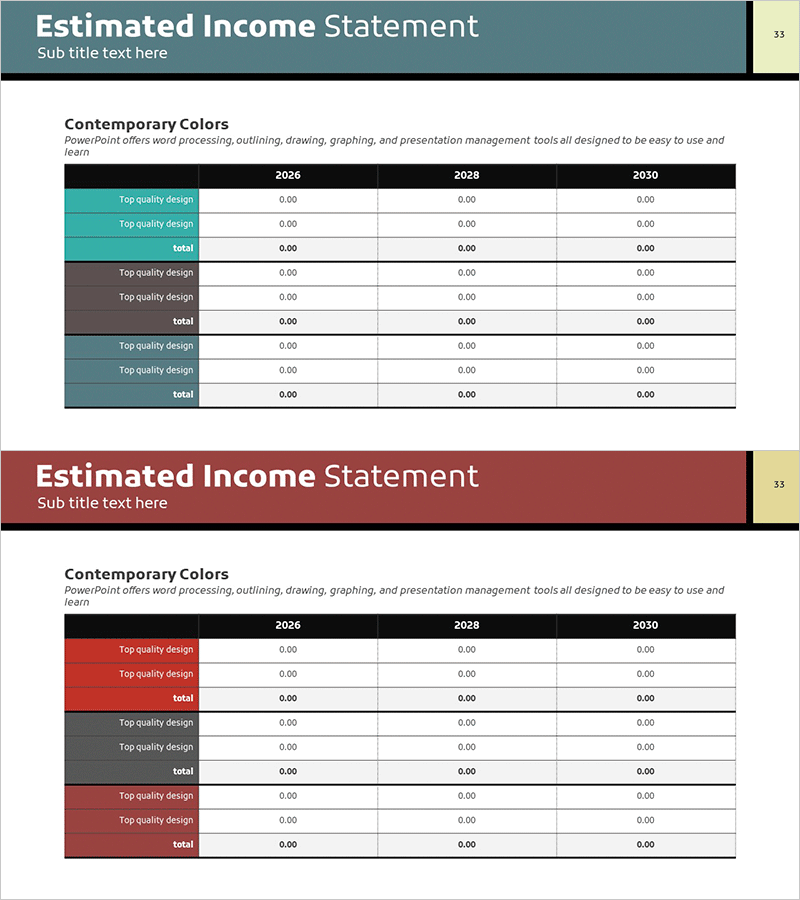
A financial data table PowerPoint slide that clearly visualizes income statement performance across multiple years. This slide features a structured comparison layout displaying financial metrics for 2026, 2028, and 2030 in a single view. The header section accommodates title and subtitle text, while the table body contains multiple data rows and subtotal rows organized by color-coded sections. Teal, gray, and wine-colored row backgrounds create clear information hierarchy, making it ideal for investor presentations, financial reports, and business plans. The 2-slide set allows flexible input of various financial figures and metrics.
Usage Points
-
Main Usage
This slide presents financial performance metrics and year-over-year comparisons to communicate profitability trends clearly. It structures numerical financial data—such as income statements, financial forecasts, and return on investment—in an organized table format to support data-driven decision-making.
-
How to Use
Enter document section titles like 'Income Statement', 'Financial Analysis', or 'Revenue Forecast' in the header area. Input line items (revenue, cost of goods sold, operating income, etc.) and corresponding year values in the table rows. Use the color-coded rows to emphasize key metrics and subtotals. Apply this slide when presenting financial performance in investor meetings or financial reports.
-
Recommended For
CFOs, financial managers, and investor relations professionals presenting financial performance. Suitable for business plan financial sections, investor relations materials, quarterly and annual financial reports, and investment pitch decks.
-
Slide Structure
The 2-slide set features a header section (title and subtitle input area) above a multi-row data table. Each table contains 3 year columns (2026, 2028, 2030) and 7–9 data rows with item names and numerical values. Row background colors (teal, gray, wine) differentiate information hierarchy and section groupings.
Related Products
-

Invoice of Required Funds for Financial Planning – A Slide for Efficient Fund Management
#Financial Plans and Performance #Diagram #Capital Requirements
-

Annual Sales and Profit Table – Clearly Presenting Financial Plans
#Financial Plans and Performance #Diagram #Capital Requirements
-

Current Camping Business Technology Status Table
#Financial Plans and Performance #Diagram #Capital Requirements
-

Clothing Business Sales and Profit Statement – Essential Tool for Business Performance
#Financial Plans and Performance #Diagram #Capital Requirements
