Clothing Business Development Status Donut Graph – Visualizing Market Share
RM0100015_11
- Last Update 01/29/2025
- File Size 3.6MB
- # of Slides 2
- File Format PPTX
- Slide Ratio 16:9
- Color
Keywords
- #Content-Based Slides
- #Design-Based Slides
- #Product/Service Introduction
- #Market and Competitor Analysis
- #Graph
- #Development Status
- #Market Share
- #Circles
- #Doughnut Chart
- #16:9
- #donut chart PowerPoint
- #pie chart slide template
- #market share visualization
- #circular graph presentation
- #ratio comparison slide
- #how to create donut chart in PowerPoint
About the Product
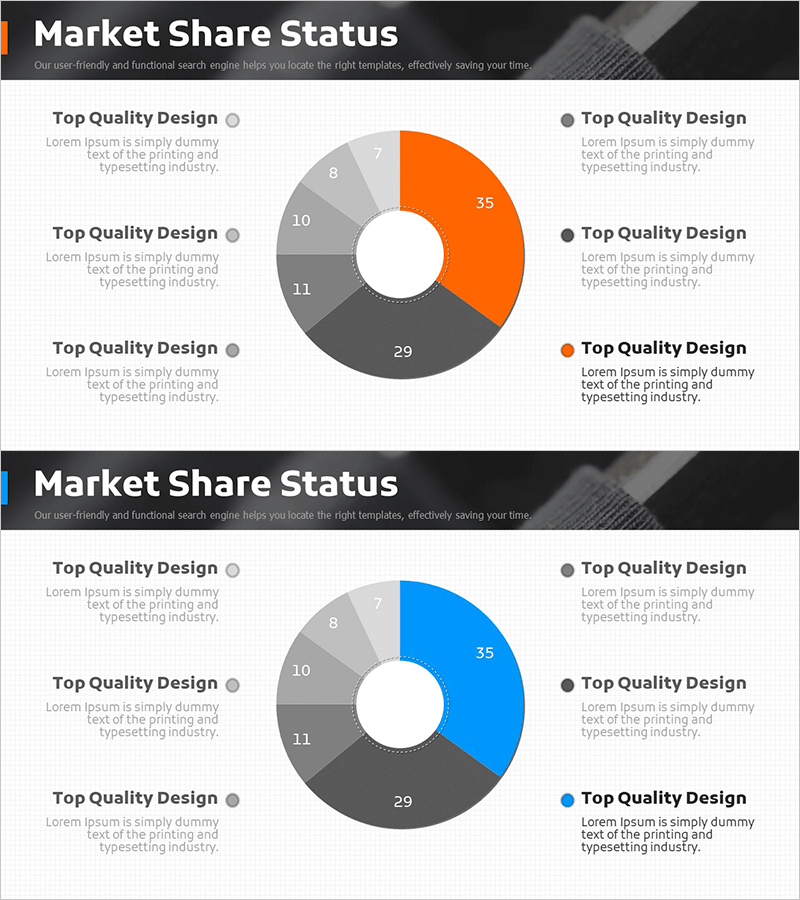
A donut-shaped pie chart PowerPoint slide visualizing the clothing business market share across four segments. The donut chart features orange, gray, and black tones with numerical values (35, 29, 11, 10, 8, 7) displayed on each segment for intuitive ratio comparison. Three text boxes on the left and a legend on the right allow detailed descriptions of each category, making it ideal for business development reports, competitive analysis, and customer composition presentations. Provided in 16:9 widescreen format with 2 slides in PPTX.
Usage Points
-
Main Usage
Visualizes business development status, market share, competitive analysis, and customer segmentation using a donut-shaped pie chart. The central hollow area allows emphasis of key metrics or titles, while segment numbers ensure accurate ratio communication.
-
How to Use
Enter category names and descriptions in the three left text boxes, then align the donut chart segment colors with the right legend. Add total figures or key messages in the center hollow area for enhanced impact. Suitable for marketing reports, business presentations, and quarterly performance reviews.
-
Recommended For
Recommended for marketing managers, business planners, financial analysts, and executive presentations. Particularly effective for fashion, apparel, consumer goods, and retail industries analyzing market segments, customer demographics, and sales channel comparisons.
-
Slide Structure
Donut-shaped pie chart with 4 segments displaying numerical values (35, 29, 11, 10, 8, 7) + three left text boxes for category descriptions + right legend with color coding. Two-slide 16:9 format with first slide emphasizing orange and second slide emphasizing blue color scheme.
Related Products
-

City Theme Market Share Graph – Business Data Visualization
#Product/Service Introduction #Market and Competitor Analysis #Graph
-

Space Exploration Donut Pie Chart
#Product/Service Introduction #Market and Competitor Analysis #Graph
-

Website Technology Development Status Graph – Market Share and Trends
#Product/Service Introduction #Market and Competitor Analysis #Graph
-

Development Status Analysis Donut Chart – Market Share Visualization
#Product/Service Introduction #Market and Competitor Analysis #Graph
