History Connection Diagram – Company Milestone Visualization
RM0100012_5
- Last Update 01/28/2025
- File Size 1.5MB
- # of Slides 2
- File Format PPTX
- Slide Ratio 16:9
- Color
Keywords
About the Product
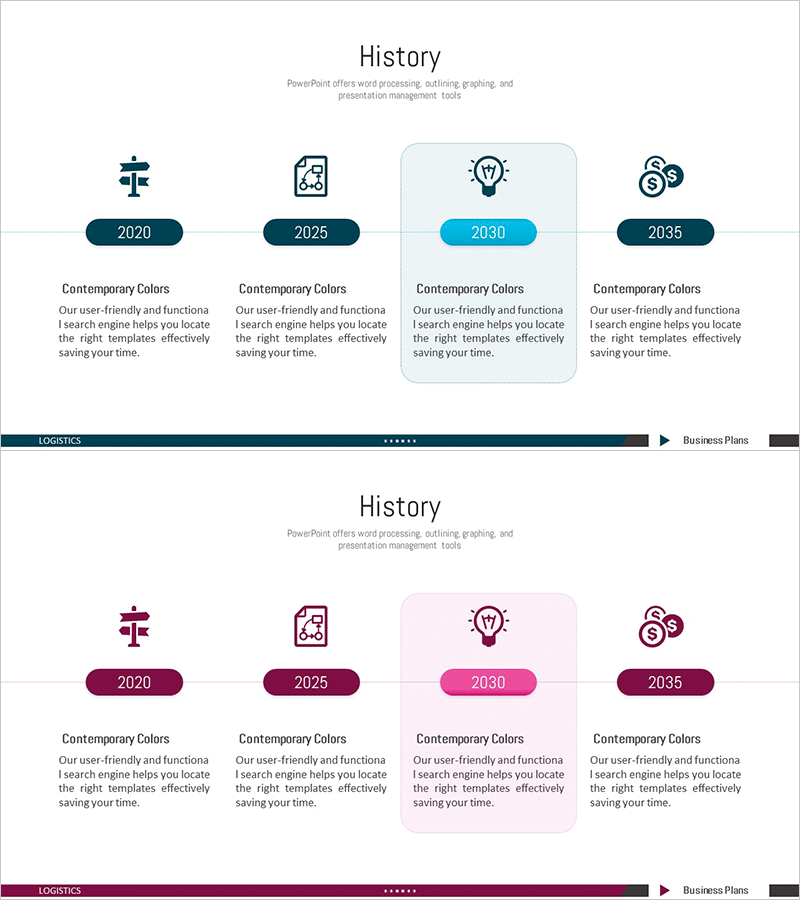
A four-stage connection diagram PowerPoint slide designed to showcase company milestones and historical development along a chronological timeline. Each node features a year badge, symbolic icon, and descriptive text area for clear visual communication of corporate growth. Available in dark blue and pink color schemes with fully editable elements. Ideal for company presentations, business reports, investor pitches, and corporate overview sections where you need to illustrate your organization's evolution and key achievements in a professional manner.
Usage Points
-
Main Usage
Effectively communicate your company's major development phases and key milestones in chronological order. The icon-based node structure makes complex corporate histories easy to understand at a glance, helping audiences grasp your organization's growth trajectory.
-
How to Use
Perfect for company overview presentations, business report sections, investor pitch decks, and corporate history slides. Simply replace the year badges, icons, and descriptive text with your company's actual milestones and achievements. All elements are independently editable and ready to customize.
-
Recommended For
Corporate communications teams, marketing and PR professionals, investor relations specialists, HR departments conducting employee onboarding, and business development teams. Suitable for startups, mid-size companies, and enterprises presenting organizational history and growth achievements.
-
Slide Structure
Four horizontally-aligned nodes connected in sequence, each containing a year badge, symbolic icon, and text description area. The timeline layout clearly shows chronological progression. Includes two color variations: dark blue and pink schemes for different presentation contexts and brand alignment.
Related Products
-

Portfolio Profile Slide – Company Timeline and Cluster
#Company Introduction #Diagram #History
-

History Road Diagram – A Cluster Diagram Ideal for Company Introduction
#Company Introduction #Diagram #History
-

Business History Diagram – Visualizing Organizational Growth
#Company Introduction #Diagram #History
-

Business Connection Diagram – Cluster and History
#Company Introduction #Diagram #Company Overview
