Balance Sheet by Business Area Presentation Slide
RM0100011_31
- Last Update 01/28/2025
- File Size 1MB
- # of Slides 2
- File Format PPTX
- Slide Ratio 16:9
- Color
Keywords
- #Content-Based Slides
- #Design-Based Slides
- #Market and Competitor Analysis
- #Financial Plans and Performance
- #Diagram
- #Balance Sheet
- #Income Statement
- #Table
- #16:9
- #balance sheet PPT slide
- #financial data PowerPoint
- #business area balance sheet
- #balance sheet PowerPoint design
- #financial analysis slide
About the Product
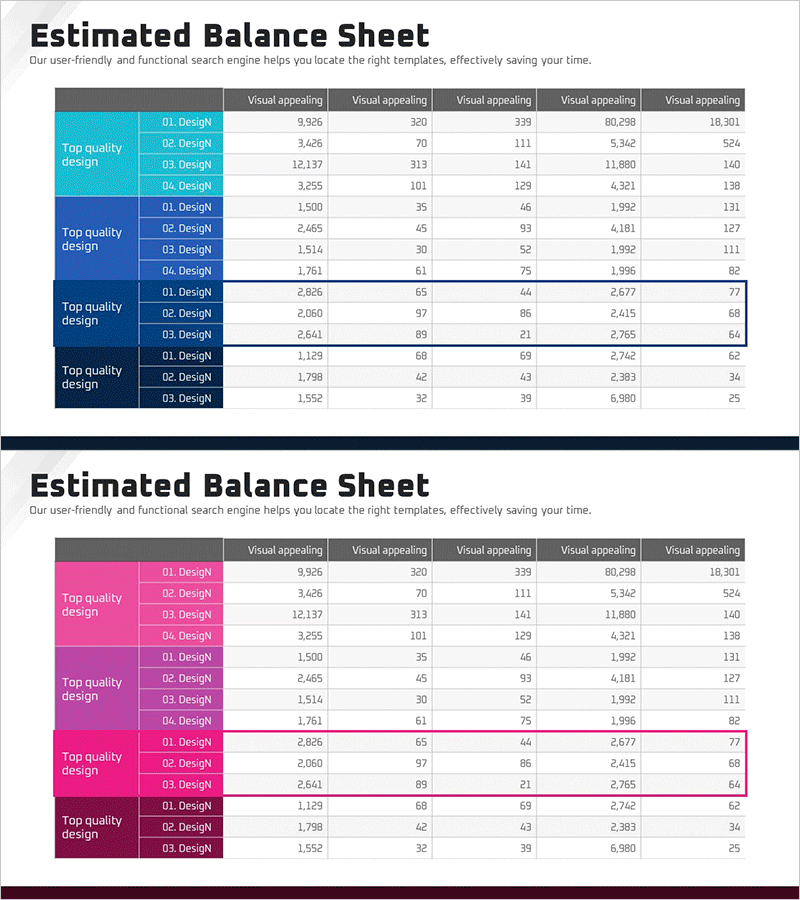
A PowerPoint slide that visualizes balance sheet data segmented by business area. The slide presents assets, liabilities, and equity across multiple business divisions in a structured table format, enabling comparative financial analysis. Color-coded columns enhance readability and allow stakeholders to quickly assess the financial position of each business segment. This presentation slide is ready for immediate use in investor presentations, executive reports, and financial analysis documents.
Usage Points
-
Main Usage
This slide presents a company's financial position across multiple business divisions using a balance sheet format. It breaks down assets, liabilities, and equity by business area, making it easy to compare financial structures across segments. Ideal for investor briefings, executive meetings, and financial reporting where segment-level financial metrics need clear visualization.
-
How to Use
Input financial figures for each business area into the table cells corresponding to assets, liabilities, and equity. The color-coded column structure automatically organizes data for comparative analysis. Use this slide during investor presentations to demonstrate financial stability, or in executive meetings to discuss segment-level financial performance and strategic allocation.
-
Recommended For
CFOs, financial analysts, executive management, and investor relations teams. Suitable for quarterly earnings presentations, investment pitch decks, business segment performance reports, and financial consulting materials. Particularly effective for multi-division corporations and holding companies disclosing segment-level financial information.
-
Slide Structure
Two-slide layout with title and description on the first slide, followed by a detailed balance sheet table on the second. The table arranges financial line items (assets, liabilities, equity) in rows and business areas in columns for horizontal comparison. Delivered in 16:9 widescreen format optimized for modern presentation environments.
Related Products
-

Balance Sheet Comparison Chart – Effective Visualization of Financial Data
#Market and Competitor Analysis #Financial Plans and Performance #Diagram
-

Balance Sheet Analysis Chart – Visualizing Financial Performance
#Financial Plans and Performance #Diagram #Balance Sheet
-

Last Year's Sales Comparison Analysis Table – Visually Representing Financial Performance
#Financial Plans and Performance #Diagram #Balance Sheet
-

Yellow Green Income Statement Table – Efficient Financial Analysis
#Financial Plans and Performance #Diagram #Balance Sheet
