Financial Status Analysis by Year – Visualization of Financial Planning
RM0100013_31
- Last Update 01/29/2025
- File Size 0.3MB
- # of Slides 2
- File Format PPTX
- Slide Ratio 16:9
- Color
Keywords
About the Product
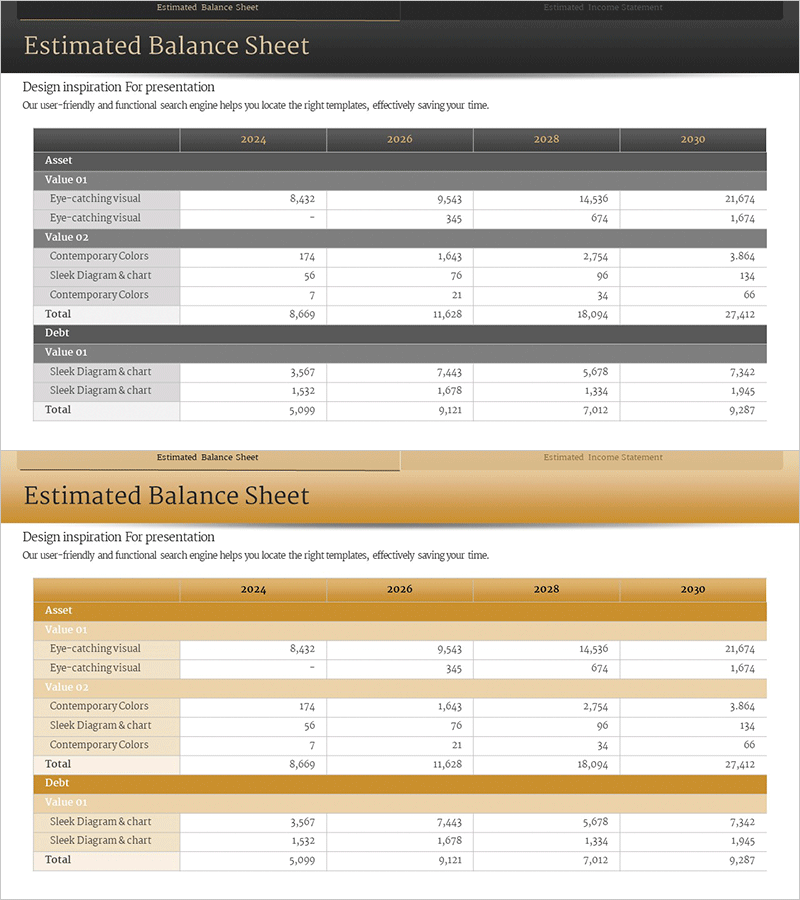
A financial status analysis PowerPoint slide that compares balance sheet data across four years (2024–2030) in a structured table format. This slide displays assets, liabilities, and equity categories in rows and columns, making it ideal for investor presentations, financial reports, and business plan financial sections. The design features a dark gray header with white data cells for maximum readability, and comes in two color themes (dark and gold) to match your corporate branding. Delivered in 16:9 aspect ratio, PPTX format, fully editable in all PowerPoint versions.
Usage Points
-
Main Usage
Demonstrates corporate financial health through visual representation of balance sheet data. The row-and-column table structure enables quick comparison of asset, liability, and equity changes across years, strengthening financial credibility in presentations to investors, financial institutions, and stakeholders.
-
How to Use
Insert this slide into IR materials, business plans, or financial reports in the financial section to explain year-over-year financial changes. Edit the table values directly with your actual financial data, select your preferred color theme (dark or gold) to align with corporate branding, and use the slide to highlight key financial metrics during presentations.
-
Recommended For
Ideal for CFOs, finance managers, and IR teams preparing investor presentations, financial reports, and business plans. Also recommended for loan applications, M&A negotiations, and employee financial briefings where financial credibility is critical.
-
Slide Structure
Two color theme variations, each containing a title area and one financial table. The table structure includes 8 rows (Asset, Value 01, three line items, Value 02, three line items, Total, Debt, Value 01, two line items, Total) and 5 columns (Item, 2024, 2026, 2028, 2030), providing 20 editable data entry fields.
Related Products
-

Asset & Liability Calculation Table – Optimized for Financial Management
#Financial Plans and Performance #Diagram #Balance Sheet
-

Visualizing Financial Status with Balance Sheet Table
#Financial Plans and Performance #Diagram #Balance Sheet
-

Blue Pink Balance Sheet Slide – Essential for Financial Performance
#Financial Plans and Performance #Diagram #Balance Sheet
-

Last Year's Sales Comparison Analysis Table – Visually Representing Financial Performance
#Financial Plans and Performance #Diagram #Balance Sheet
